Silver Technical Analysis | Bullish Wedge
BY Janne Muta
|January 23, 2024Silver Technical Analysis – As Fed Funds futures traders have moderated their rate cut expectations the dollar has remained strong pressuring the precious metals complex with silver trading down in recent weeks. However, silver's industrial demand is expected to rise in 2024, particularly from the solar sector. Analysts remain positive about the silver market emphasising the ongoing supply deficit.
Last year the demand decrease mainly affected the jewellery, silverware, and physical investment sectors, interpreted more as a correction than a collapse. However, supply struggles to meet the growing demand, with mining and recycling insufficient for future needs. Forecasts suggest strong demand growth, especially in the industrial and solar sectors, despite potential global economic slowdowns.
Summary of This Silver Technical Analysis Report:
- While the 21.87 level is the nearest support the nearest key resistance level is the market structure level at 22.50. A decisive break above this level would open the way to 23.40. Alternatively, below 24.60 the bullish trend channel low could be tested.
- The 4-hour chart shows silver hesitating at a minor resistance level at 22.40.The stochastic oscillator is close to the overbought area and could soon give a sell signal. With the moving averages pointing lower and the 20. SMA below the 50 period SMA this could result in another leg lower.
Read the full Silver technical analysis report below.
Silver Technical Analysis
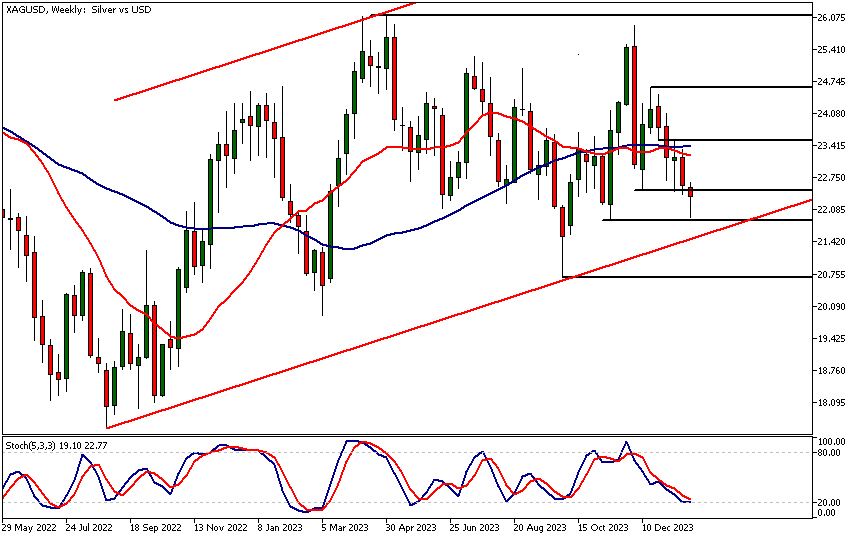
Weekly Silver Technical Analysis
After the silver market created a lower swing high at 24.60 silver has traded down to a key support level (21.87) that's relatively close to the rising bull channel low (currently at 21.47). As a result, the market is close to oversold levels both in terms of price action-based silver technical analysis and indicator-based analysis. The stochastic oscillator is currently at the oversold threshold (20).
While the 21.87 level is the nearest support the nearest key resistance level is the market structure level at 22.50. A decisive break above this level would open the way to 23.40. Alternatively, below 24.60 the bullish trend channel low could be tested.
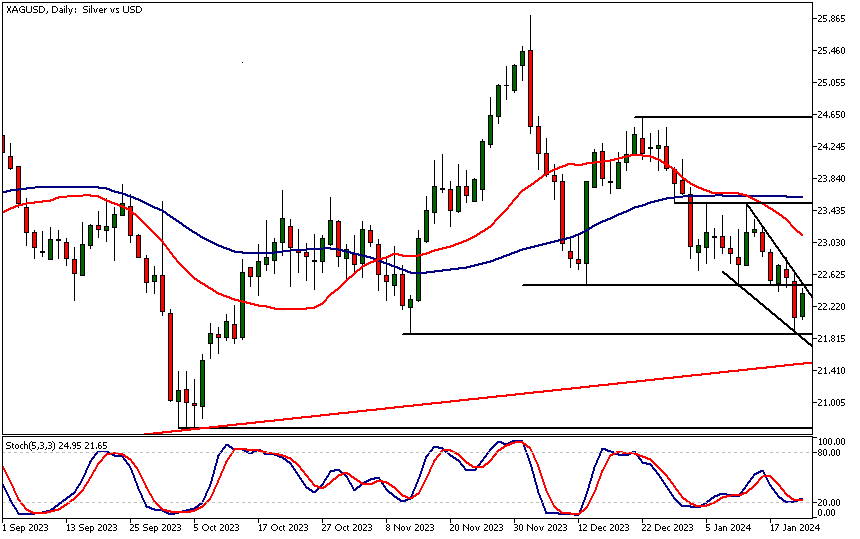
Daily Silver Technical Analysis
Silver is trading inside a bullish wedge. If the market manages to break out of the wedge the move to the 23.40 level mentioned above in the daily silver technical analysis section would look more likely. USD strength has been pressuring XAGUSD lately as the Fed rate cut expectations for March have become more moderate. USD continuing to trade higher would be a significant short-term risk factor for those considering XAGUSD longs.
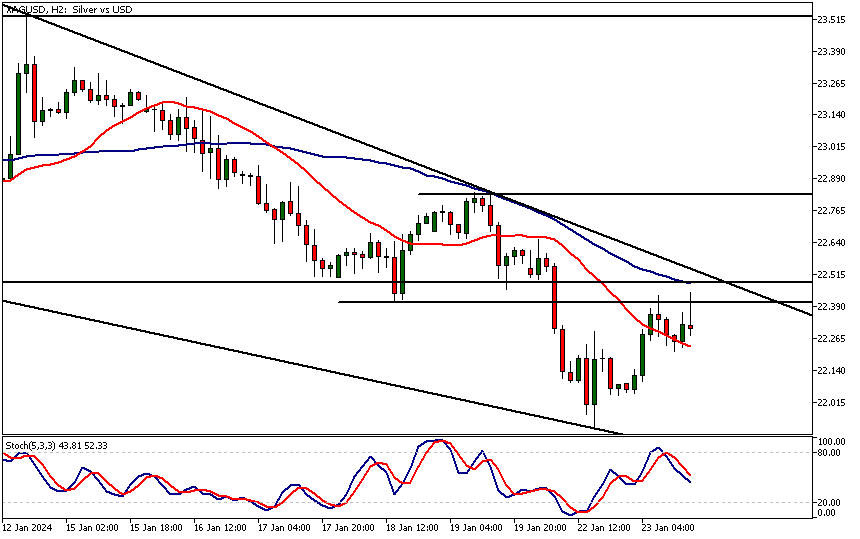
Intraday Silver Technical Analysis
The 2-hour chart shows silver hesitating at a minor resistance level at 22.40.The stochastic oscillator is close to the overbought area and could soon give a sell signal. With the moving averages pointing lower and the 20. SMA below the 50 period SMA this could result in another leg lower. However, if the market can push itself decisively above the 22.40 level the next 4-hour resistance level at 22.83 could come into play.
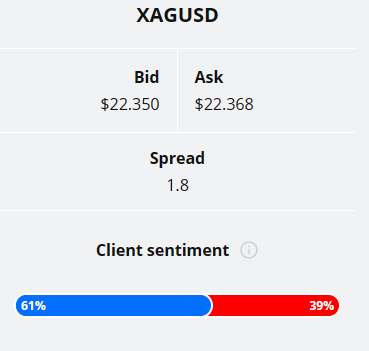
Client sentiment analysis
61% of clients trading XAGUSD are holding long positions, while 39% are holding short positions. Client sentiment data is being provided by TIO Markets Ltd.
Please note that retail client trading sentiment is often said to be a contrarian indicator. This is because trade data suggests that private (non-professional) traders, on average, trade against market price trends. You can follow the TIOmarkets client sentiment live on our Forex dashboard.
The next key risk events impacting this market
- USD - Richmond Manufacturing Index
- USD - Flash Manufacturing PMI
- USD - Flash Services PMI
- USD - Advance GDP q/q
- USD - Unemployment Claims
- USD - Advance GDP Price Index q/q
- USD - Core Durable Goods Orders m/m
- USD - Durable Goods Orders m/m
- USD - New Home Sales
- USD - Core PCE Price Index m/m
- USD - Pending Home Sales m/m
Potential Silver Market Moves
While the 21.87 level is the nearest support the nearest key resistance level is the market structure level at 22.50. A decisive break above this level would open the way to 23.40. Alternatively, below 24.60 the bullish trend channel low could be tested.

How Would You Trade Silver Today?
I hope this silver technical analysis helps you to make better informed trading decisions. Check the latest market analysis for other instruments and subscribe to receive them in your inbox as soon as they are published
DISCLAIMER: TIO Markets offers an exclusively execution-only service. The views expressed are for information purposes only. None of the content provided constitutes any form of investment advice. The comments are made available purely for educational and marketing purposes and do NOT constitute advice or investment recommendation (and should not be considered as such) and do not in any way constitute an invitation to acquire any financial instrument or product. TIOmarkets and its affiliates and consultants are not liable for any damages that may be caused by individual comments or statements by TIOmarkets analysis and assumes no liability with respect to the completeness and correctness of the content presented. The investor is solely responsible for the risk of his/her investment decisions. The analyses and comments presented do not include any consideration of your personal investment objectives, financial circumstances, or needs. The content has not been prepared in accordance with any legal requirements for financial analysis and must, therefore, be viewed by the reader as marketing information. TIOmarkets prohibits duplication or publication without explicit approval.

Janne Muta holds an M.Sc in finance and has over 20 years experience in analysing and trading the financial markets.
Related Posts


Trade responsibly: CFDs are complex instruments and come with a high risk of losing all your invested capital due to leverage.