Silver Technical Analysis | The market rallies 8%
BY Janne Muta
|November 16, 2023Silver Technical Analysis – The silver market has rallied strongly over the last few days (+8%) after the US CPI numbers came in below expectations and drove the risky assets higher and pressured the dollar. Furthermore, Chinese economic data this week, particularly the increase in industrial production and retail sales year-over-year, has supported silver prices.
Higher industrial production suggests economic growth and stability, which can boost investor confidence. Meanwhile, stronger retail sales indicate healthy consumer spending, reflecting economic resilience.
Other factors driving the silver price higher include the expectation of record-high industrial demand and significant interest rate dynamics. Specifically, the anticipated end of the Federal Reserve's interest rate hikes and potential rate cuts, combined with an expected economic recovery post-recession, are likely to enhance silver's value in the medium to long term.
Summary of This Silver Technical Analysis Report:
- The market has rallied approximately 8% in less than a week. Silver, being an industrial metal, benefits from improved risk sentiment and the recent strong rally in stocks, accompanied by dollar weakness, has propelled the silver market higher.
- The daily time frame chart shows a strong rally from a reversal candle three days ago. Such a strong rally indicates institutional buying in the silver market and could lead to the market breaking above the resistance level at 23.77. However, resistance is still resistance until it is successfully penetrated.
- Silver prices have rallied following lower-than-expected US CPI numbers and positive Chinese economic data, indicating strong industrial production and retail sales. Expectations of high industrial demand and changes in interest rate dynamics, particularly the end of the Fed's rate hikes, along with post-recession recovery prospects, are further boosting silver's medium to long-term value.
Read the full Silver technical analysis report below.
Silver Technical Analysis
Weekly Silver Technical Analysis
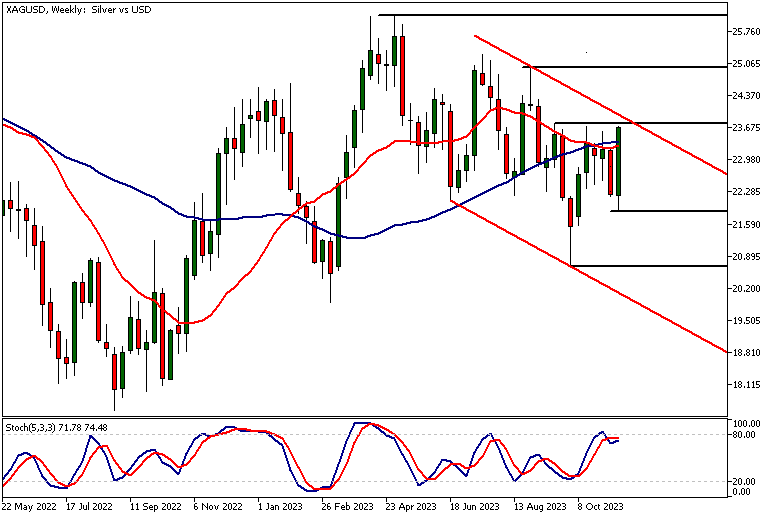
The market has rallied approximately 8% in less than a week. Silver, being an industrial metal, benefits from improved risk sentiment and the recent strong rally in stocks, accompanied by dollar weakness, has propelled the silver market higher.
As a result, the market has created a higher weekly swing low at 21.87, which in itself is a bullish indication. However, at the same time, the market has reached a key resistance level at 23.77. This level is fairly closely aligned with a bear channel high and could therefore attract profit-taking.
Importance of the bear channel high
However, if the market is able to break above the bear channel high, silver technical analysis suggests it could move to 25.00 or so. Alternatively, a failure to penetrate the bear channel high would indicate that down to levels below this week's low could be likely. Should that be the case, look for a move down to 21.20.
Daily Silver Technical Analysis
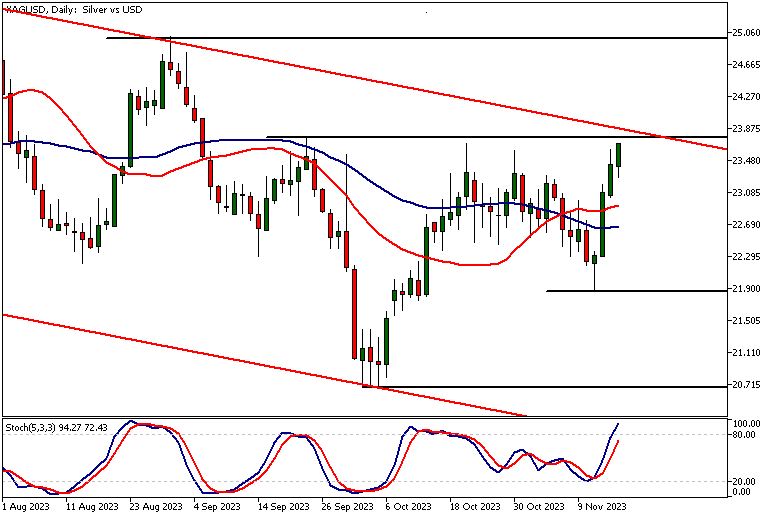
The daily time frame chart shows a strong rally from a reversal candle three days ago. Such a strong rally indicates institutional buying in the silver market and could lead to the market breaking above the resistance level at 23.77.
However, resistance is still resistance until it is successfully penetrated. Therefore, those employing indicator-oriented silver technical analysis might want to pay attention to the stochastic oscillator in the overbought territory at the time of writing this.
The role of indicators
An indicator reading alone isn't a reason to open or close trades; indicators can alert traders to potential trade setups and invite them to further analysis in the market. The nearest key support level is the rejection candle low at 21.87, while the next major resistance level above 23.77 can be found at 25.00.
Oversold Stochastic Oscillator
The stochastic oscillator is close to the oversold level which ties together with the fact that the market is trading at the range low. The moving averages are in the middle of the trading range and roughly moving sideways. This is typical in range-bound markets.
The nearest key resistance level in the daily chart can be found at 23.30 while the nearest daily support level below 22.36 is at 21.74. As a rule, traders tend to look for reasons to use mean reversion strategies near the edges of trading ranges. Only after the market breaks out of the trading range do traders usually look for directional trades.
Silver Technical Analysis, 2h
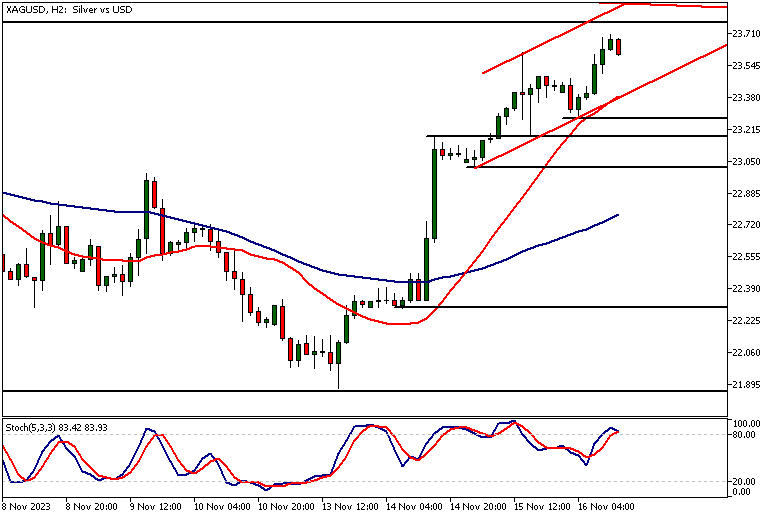
The two-hour chart shows the silver market moving strongly higher and creating higher lows. Moving average-based silver technical analysis suggests strength with the 20-period moving average above the 50-period and with both moving averages pointing higher.
The market is also trading inside a bullish trend channel, with the low of the channel coinciding with the 20-period moving average. The key support levels in this timeframe are at 22.29, 23.02, 23.19, and 23.27. The recent strength suggests that potential retracements to these key support levels could attract renewed buying in the silver market.
Client sentiment analysis
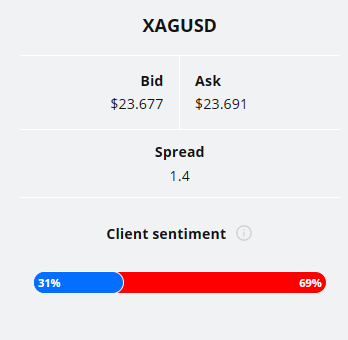
The TIOmarkets client sentiment graph shows 69% of traders are short and 31% are long the silver market.
Please remember that the retail trader client sentiment is a contrarian indicator as most of the retail traders are on average betting against the market trends. This is why, experienced traders tend to trade against the retail client sentiment. You can follow the TIOmarkets client sentiment live on our Forex dashboard.
The next key risk events impacting this market:
- USD - Unemployment Claims
- USD - Philly Fed Manufacturing Index
- USD - Industrial Production m/m
- USD - Building Permits
- USD - Existing Home Sales
- USD - FOMC Meeting Minutes
Potential Silver Market Moves
However, if the market is able to break above the bear channel high, silver technical analysis suggests it could move to 25.00 or so. Alternatively, a failure to penetrate the bear channel high would indicate that down to levels below this week's low could be likely. Should that be the case, look for a move down to 21.20.

How would you trade the Silver today?
I hope this fundamental and technical Silver analysis helps you to make better informed trading decisions. Check the latest market analysis for other instruments and subscribe to receive them in your inbox as soon as they are published
DISCLAIMER: TIO Markets offers an exclusively execution-only service. The views expressed are for information purposes only. None of the content provided constitutes any form of investment advice. The comments are made available purely for educational and marketing purposes and do NOT constitute advice or investment recommendation (and should not be considered as such) and do not in any way constitute an invitation to acquire any financial instrument or product. TIOmarkets and its affiliates and consultants are not liable for any damages that may be caused by individual comments or statements by TIOmarkets analysis and assumes no liability with respect to the completeness and correctness of the content presented. The investor is solely responsible for the risk of his/her investment decisions. The analyses and comments presented do not include any consideration of your personal investment objectives, financial circumstances, or needs. The content has not been prepared in accordance with any legal requirements for financial analysis and must, therefore, be viewed by the reader as marketing information. TIOmarkets prohibits duplication or publication without explicit approval.

Janne Muta holds an M.Sc in finance and has over 20 years experience in analysing and trading the financial markets.
Related Posts


Trade responsibly: CFDs are complex instruments and come with a high risk of losing all your invested capital due to leverage.