Silver Technical Analysis | The market trades at bear channel high
BY Janne Muta
|November 21, 2023Silver Technical Analysis – XAGUSD is having trouble moving higher even though the USD is getting weaker. The lower yields have made the dollar less attractive as the market expects the Fed rate policy to become more accommodative. Silver has been rallying with the stock market lately, but in the past few days, it's lost momentum at a technical resistance area.
In theory, weak USD together with expected increase in silver demand for green technologies should support the precious metals sector in the long run and help silver to rally more.
Although recent comments from some Fed officials have not ruled out the possibility of more rate hikes markets have priced out any additional Fed rate hikes. As recent data shows a US slowing economy and inflation pressures investors expect the Fed has completed its interest rate hike cycle and look towards when the central bank may start to cut rates.
Note that, the release of the Fed's latest meeting minutes today is closely watched by market operators for signals on the central bank's policy path.
Summary of This Silver Technical Analysis Report:
- Silver continues to trade within a bearish trend channel. However, the market created a higher swing low on the weekly chart last week, suggesting strength. Therefore, the bulls might attempt to push the market higher, but a breakout above the bear channel's high is needed before anticipating further bullishness in the market.
- In the daily timeframe, silver is trading near the top of a descending trend channel. The bearish rejection candle two days ago suggests that the market could retrace lower.
- The four-hour chart shows that the market has bounced higher after retracing back to a support level. The market has therefore created a higher swing low at this level, and the 23.24 low is now the nearest key support level. However, the market is also trading at a higher timeframe resistance.
Read the full Silver technical analysis report below.
Silver Technical Analysis
Weekly Silver Technical Analysis
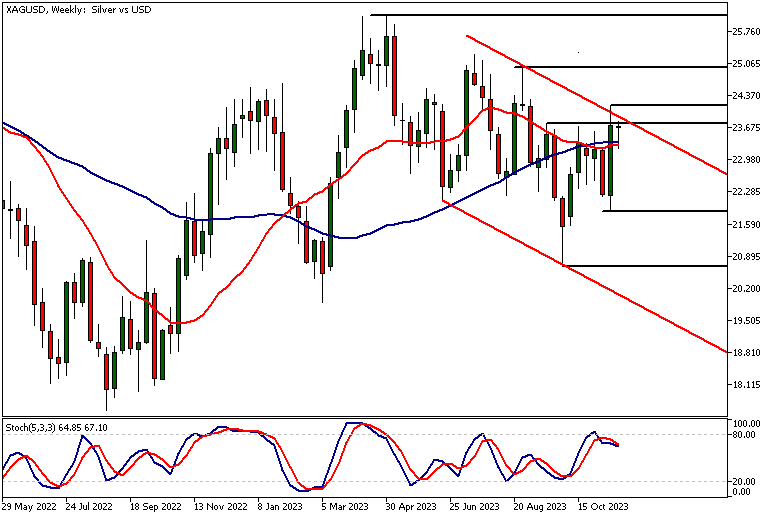
Silver continues to trade within a bearish trend channel. However, the market created a higher swing low on the weekly chart last week, suggesting strength.
Therefore, the bulls might attempt to push the market higher, but a breakout above the bear channel's high is needed before anticipating further bullishness in the market. The nearest key support level on the weekly timeframe is at 22.19, while the nearest major resistance level above last week's high is at 25.01.
Overbought condition
According to indicator-oriented silver technical analysis, the market is nearing overbought levels, while the moving averages present mixed signals. The 20-period SMA is below the 50-period SMA, but the 50-period moving average is still pointing higher, suggesting the market has a mild upside bias.
Daily Silver Technical Analysis
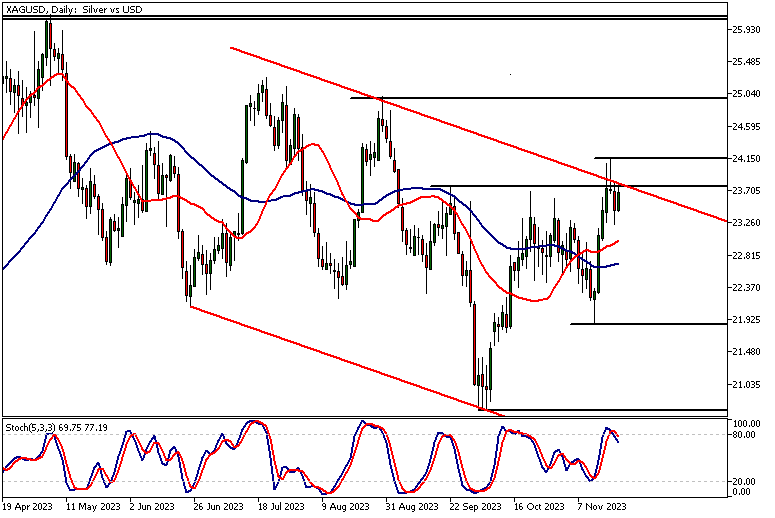
In the daily timeframe, silver is trading near the top of a descending trend channel. The bearish rejection candle two days ago suggests that the market could retrace lower.
If the 24.14 high cannot be exceeded decisively, we could see the market moving down to the 22.85 - 23.00 range. Indicator-based silver technical analysis suggests that the market is now overbought, with the stochastic oscillator nearing the overbought area. Note also that the indicator has just given a sell signal.
Alternatively, if the market remains bullish and breaks above 24.14, this could pave the way to 24.70, and then potentially to 26.00 as an extension.
Silver Technical Analysis, 4h
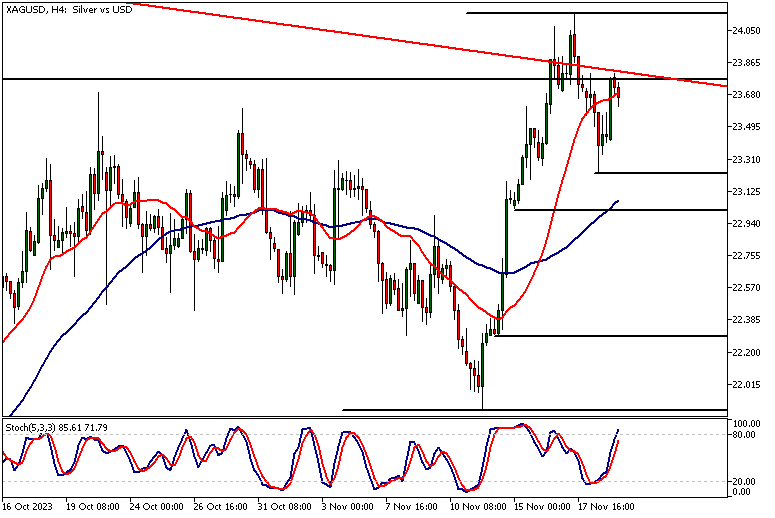
The four-hour chart shows that the market has bounced higher after retracing back to a support level. The market has therefore created a higher swing low at this level, and the 23.24 low is now the nearest key support level.
However, the market is also trading at a higher timeframe resistance. Silver has moved back to the bear channel high, and the stochastic oscillator is in the overbought area. As per our silver technical analysis the nearest key resistance level is the 24.14 high. Above this high, we could see the market moving to 24.70, while below 23.24, a move down to 22.85 could be likely.
Client sentiment analysis
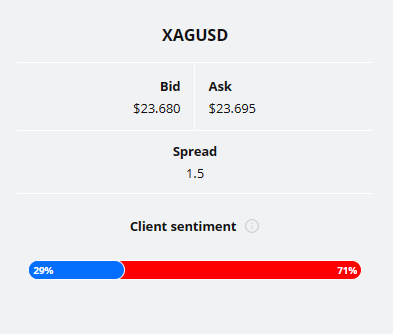
The TIOmarkets client sentiment graph shows 71% of traders are short and 29% are long the silver market.
Please remember that the retail trader client sentiment is a contrarian indicator as most of the retail traders are on average betting against the market trends. This is why, experienced traders tend to trade against the retail client sentiment. You can follow the TIOmarkets client sentiment live on our Forex dashboard.
The next key risk events impacting this market:
- USD - Existing Home Sales
- USD - FOMC Meeting Minutes
- USD - Unemployment Claims
- USD - Core Durable Goods Orders
- USD - Durable Goods Orders
- USD - Revised UoM Consumer Sentiment
- USD - Flash Manufacturing PMI
- USD - Flash Services PMI
Potential Silver Market Moves
If the 24.14 high cannot be exceeded decisively, we could see the market moving down to the 22.85 - 23.00 range. Indicator-based silver technical analysis suggests that the market is now overbought, with the stochastic oscillator nearing the overbought area.
Note also that the indicator has just given a sell signal. Alternatively, if the market remains bullish and breaks above 24.14, this could pave the way to 24.70, and then potentially to 26.00 as an extension.

How would you trade the Silver today?
I hope this silver technical analysis helps you to make better informed trading decisions. Check the latest market analysis for other instruments and subscribe to receive them in your inbox as soon as they are published
DISCLAIMER: TIO Markets offers an exclusively execution-only service. The views expressed are for information purposes only. None of the content provided constitutes any form of investment advice. The comments are made available purely for educational and marketing purposes and do NOT constitute advice or investment recommendation (and should not be considered as such) and do not in any way constitute an invitation to acquire any financial instrument or product. TIOmarkets and its affiliates and consultants are not liable for any damages that may be caused by individual comments or statements by TIOmarkets analysis and assumes no liability with respect to the completeness and correctness of the content presented. The investor is solely responsible for the risk of his/her investment decisions. The analyses and comments presented do not include any consideration of your personal investment objectives, financial circumstances, or needs. The content has not been prepared in accordance with any legal requirements for financial analysis and must, therefore, be viewed by the reader as marketing information. TIOmarkets prohibits duplication or publication without explicit approval.

Janne Muta holds an M.Sc in finance and has over 20 years experience in analysing and trading the financial markets.
Related Posts


Trade responsibly: CFDs are complex instruments and come with a high risk of losing all your invested capital due to leverage.