Silver Technical Analysis | XAGUSD gains 5% in just 3 days
BY Janne Muta
|November 27, 2023Silver Technical Analysis – The silver market has rallied strongly after a period of consolidation as Gold started to move higher. This surge is underpinned by strong industrial demand for silver in key sectors such as photovoltaics, electronics, and 5G networks. Silver has seen a notable increase of almost 5% in just three days, buoyed by its close correlation with the rising gold market.
The demand in industrial contexts remains strong while the market faces a significant supply shortage. A notable deficit in silver production means upward price pressures should remain in the foreseeable future.
Moreover, traders in the FED funds futures market are anticipating up to four rate cuts by the Federal Reserve in 2024. This speculation keeps the U.S. dollar under pressure, which in turn contributes positively to the upward momentum in the XAGUSD.
Summary of This Silver Technical Analysis Report:
- Silver has broken out of the bearish trend channel, as focused on in the previous silver technical analysis report. The breakout followed after the market created a higher swing low at 21.87, and now the market is trading towards the April high at 26.13.
- Silver has broken out of a consolidation formation (bull flag) as it continues to rally. The market rallied 10% before the consolidation started, and now that the bull flag pattern has been resolved to the upside, we might see further upside in this market. A measured move target based on the bull flag pattern suggests that the market could trade to the April high at 26.13.
- The 8-hour chart also provides a bullish technical picture for silver, with the market rallying strongly higher after it broke out of the consolidation triangle formation.
Read the full Silver technical analysis report below.
Silver Technical Analysis
Weekly Silver Technical Analysis
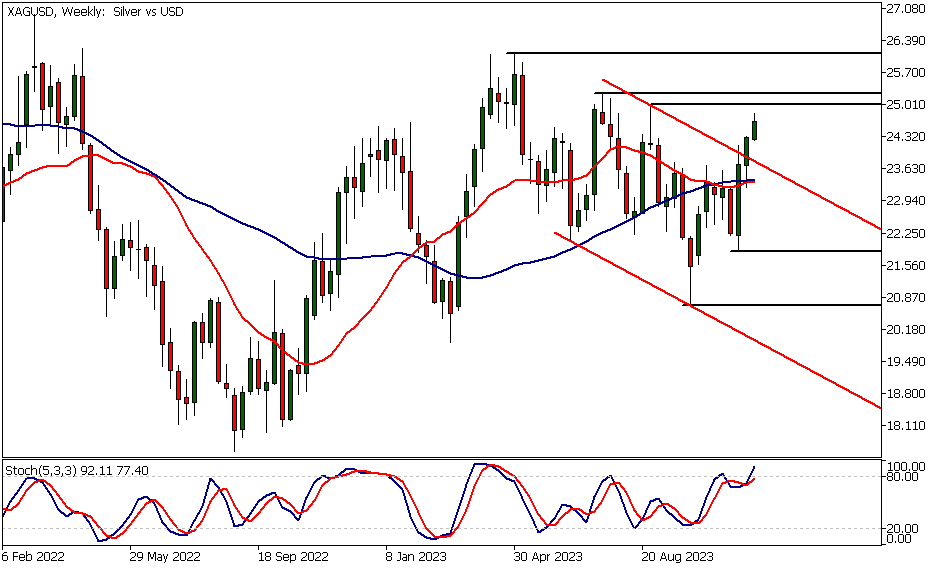
Silver has broken out of the bearish trend channel, as focused on in the previous silver technical analysis report. The breakout followed after the market created a higher swing low at 21.87, and now the market is trading towards the April high at 26.13.
However, it needs to clear any potential supply near the July and August highs at 25.00 and 25.26, respectively. If this resistance area is cleared, we could see the market trading up to 26.13. Alternatively, the key weekly support level at 26.69 might be tested.
Daily Silver Technical Analysis
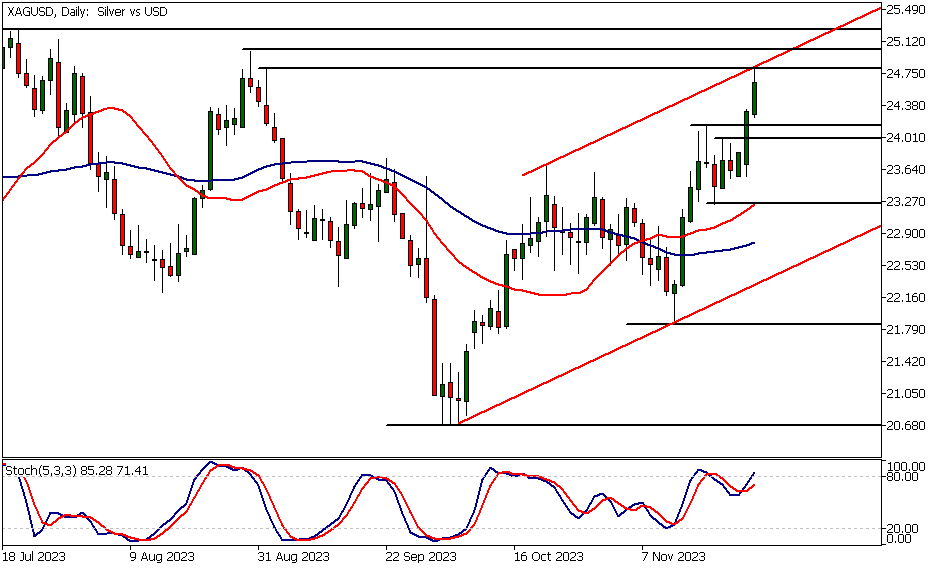
Silver has broken out of a consolidation formation (bull flag) as it continues to rally. The market rallied 10% before the consolidation started, and now that the bull flag pattern has been resolved to the upside, we might see further upside in this market. A measured move target based on the bull flag pattern suggests that the market could trade to the April high at 26.13.
However, currently silver is trading near resistance levels. The market has tested a bull channel top at 24.81 and reacted lower. The channel top coincides with a daily high from the beginning of September. If we see a deeper retracement, the nearest support levels at 24.01 and 24.14 could come into play.
Key technical price levels
The nearest major daily resistance level can be found at 25.00. Should the nearest support levels fail to attract buying, we could see the market trading down to 23.70.
As the 20-period moving average is above the 50-period SMA, and the market trades well above the 20-period SMA, the indicator-based silver technical analysis suggests that the market is bullish. The stochastic oscillator is in the overbought area, which is common during uptrends and therefore not a significant indication.
However, it can help us in drawing our attention to the fact that the market is trading relatively close to a resistance created by the bull channel top.
Silver Technical Analysis, 8h
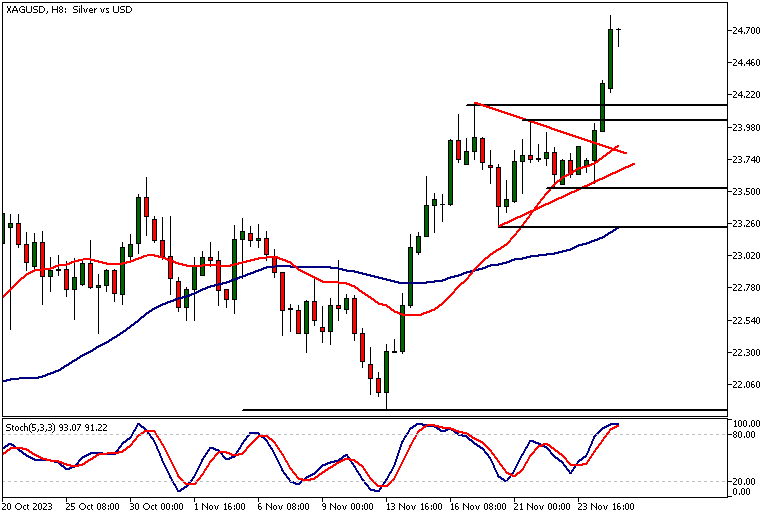
The 8-hour chart also provides a bullish technical picture for silver, with the market rallying strongly higher after it broke out of the consolidation triangle formation.
Indicator-based silver technical analysis also points to strong upside momentum in this market, with the stochastic oscillator in the overbought area and the moving averages pointing higher. The fast-moving average is above the slow, and the market trades above the fast SMA.
Client sentiment analysis
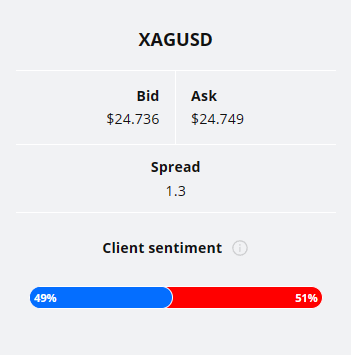
The TIOmarkets client sentiment doesn't provide indication on retail trader sentiment as 51% of traders are short and 49% long.
Please remember that the retail trader client sentiment is a contrarian indicator as most of the retail traders are on average betting against the market trends. This is why, experienced traders tend to trade against the retail client sentiment. You can follow the TIOmarkets client sentiment live on our Forex dashboard.
The next key risk events impacting this market
- US S&P/CS Composite-20 HPI
- US CB Consumer Confidence
- US Richmond Manufacturing Index
- US FOMC Member Waller Speaks
- US Prelim GDP
- US Prelim GDP Price Index
- US Core PCE Price Index m/m
- US Unemployment Claims
- US Chicago PMI
- US Pending Home Sales
- US ISM Manufacturing PMI
- US ISM Manufacturing Prices
- US Fed Chair Powell Speaks
Potential Silver Market Moves
A measured move target based on the bull flag pattern suggests that the market could trade to the April high at 26.13. However, currently silver is trading near resistance levels. If we see a deeper retracement, the nearest support levels at 24.01 and 24.14 could come into play. Should the nearest support levels fail to attract buying, we could see the market trading down to 23.70.

How would you trade the Silver today?
I hope this silver technical analysis helps you to make better informed trading decisions. Check the latest market analysis for other instruments and subscribe to receive them in your inbox as soon as they are published
DISCLAIMER: TIO Markets offers an exclusively execution-only service. The views expressed are for information purposes only. None of the content provided constitutes any form of investment advice. The comments are made available purely for educational and marketing purposes and do NOT constitute advice or investment recommendation (and should not be considered as such) and do not in any way constitute an invitation to acquire any financial instrument or product. TIOmarkets and its affiliates and consultants are not liable for any damages that may be caused by individual comments or statements by TIOmarkets analysis and assumes no liability with respect to the completeness and correctness of the content presented. The investor is solely responsible for the risk of his/her investment decisions. The analyses and comments presented do not include any consideration of your personal investment objectives, financial circumstances, or needs. The content has not been prepared in accordance with any legal requirements for financial analysis and must, therefore, be viewed by the reader as marketing information. TIOmarkets prohibits duplication or publication without explicit approval.

Janne Muta holds an M.Sc in finance and has over 20 years experience in analysing and trading the financial markets.
Related Posts


Trade responsibly: CFDs are complex instruments and come with a high risk of losing all your invested capital due to leverage.