USDCAD Analysis | Bearish Wedge At Key Resistance Area
BY Janne Muta
|October 31, 2023USDCAD Analysis - Canada's GDP growth for August is expected to come in at 0.1% later on today, with the wholesale and finance sectors as the main drivers.
July's GDP remained unchanged, after June's 0.2% drop. The anticipated 0.1% growth in GDP is projected to be driven primarily by the wholesale trade and finance sectors. However, this growth may be mitigated by challenges facing the retail and oil and gas industries. Previous months have showcased a stagnant GDP in July and a 0.2% contraction in June.
The market predicts currently an 85% likelihood of a rate cut by Q3 2024 after the BoC’s recent decision to maintain its overnight rate unchanged at a historic 5% level. Therefore, the CAD may continue to face downward pressures, especially if the Bank of Canada leans more towards easing in response to the mixed economic indicators.
This is subject to the Fed rate decision and its signalling about the future rate path though. The markets expect the Fed hold the rates unchanged in tomorrow’s meeting. The high yields are doing the work for the Fed. The Fed Funds Futures traders are currently betting the next rate move by the Fed will be to the downside by a quarter of percentage point in June 2023.
Summary of this USDCAD analysis report
- The USDCAD has reached levels it failed to move past in March leading to a 775 pip move lower. The market faces resistance, potentially with limited upside. Stochastic readings show overbought conditions as the market is trading near the upper end of a vast trading range.
- USDCAD trades in a daily bearish wedge, aligning with weekly resistance at 1.3861. With an overbought stochastic oscillator, breaking below 1.3820 might lead to declines between 1.3395 and 1.3485. The 1.3569 support, matching the 38.2% Fibonacci level, is key.
- The 4-hour USDCAD chart shows key support at 1.3796. Breaking it might lead to 1.3740. Moving averages are bullish, and a rise above 1.3796 might retest 1.3880. Yet, weekly analysis hints at increased downward pressure.
Read our full USDCAD analysis report below.
USDCAD Analysis
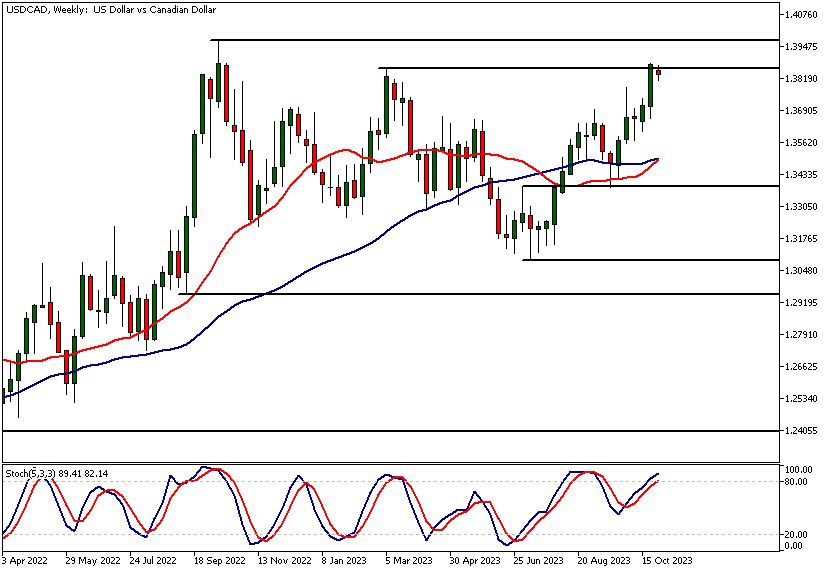
USDCAD Analysis, Weekly
The USDCAD currency pair has rallied to levels it hasn't been able to hold in the past. The last time the rally failed at similar levels was in March this year. This rally failure led to a 775 pip or 5.6% move to the downside. Now that the market has rallied back to this resistance, the immediate upside could be limited.
Indicator based USDCAD analysis shows the stochastic oscillator in overbought territory with a current stochastic value of 81.99. The 50-period moving average points higher, but the market is currently far from this average and close to the 1.3861 resistance level.
Therefore, we must conclude that the market is not in trending mode but moving sideways in a sizable range. The next major resistance level above 1.3861 is at 1.3977, while the nearest major support level is at 1.3381.
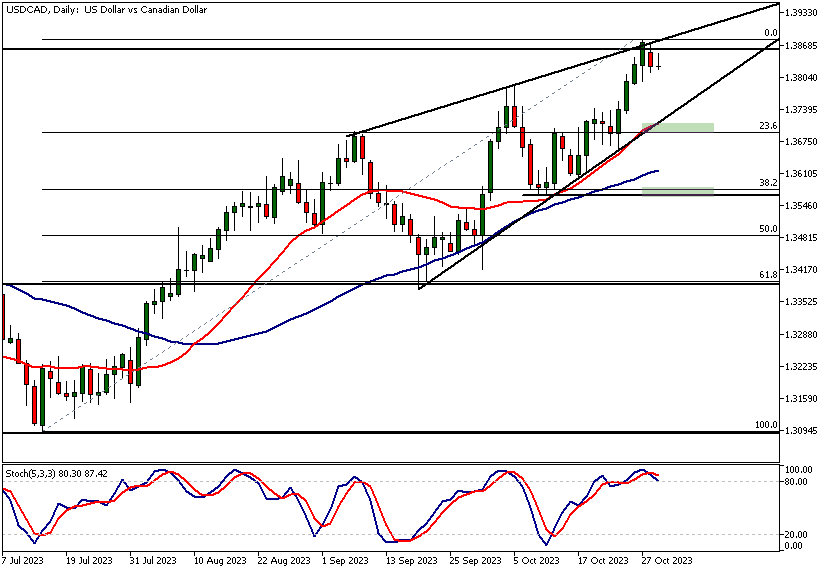
USDCAD Analysis, Daily
USDCAD is trading inside a bearish wedge on the daily chart. The upper end of the wedge coincides with the weekly timeframe resistance level (see the weekly USDCAD analysis above) at 1.3861, where the market is currently trading. Note also that the stochastic oscillator is currently overbought in this timeframe.
The nearest support level
The nearest support level is the wedge low at 1.3820, which coincides with the 20-period SMA. If the market breaks below 1.3820 decisively, we have a bearish wedge breakout, in which case we could see the market moving down to levels between the 50% and 61.8% Fibonacci retracement levels (1.3395 -1.3485).
A measured move projection that is based on the width of the bearish wedge points to this range. However, note that the market needs to penetrate the 1.3569 support level before this down move can take place. This level coincides with the 38.2% Fibonacci retracement level and could therefore be a significant support level.
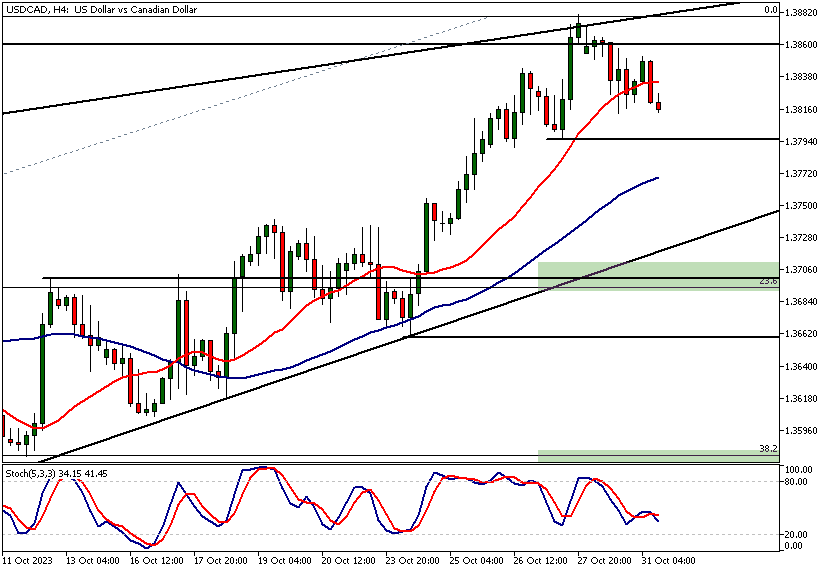
USDCAD Analysis, 4h
The 4-hour chart reveals a key support level at 1.3796. If this level is broken decisively, a move down to 1.3740 could be likely. In this timeframe, the moving averages are bullish, with the 20-period moving average above the 50-period.
Supply above?
Also, these averages are pointing higher. If the market attracts buyers above 1.3796, it could retest the 1.3880 level again. However, the current market context, as noted in the weekly USDCAD analysis, suggests the market could be facing supply above the current levels, and therefore the probability for a down move has increased.
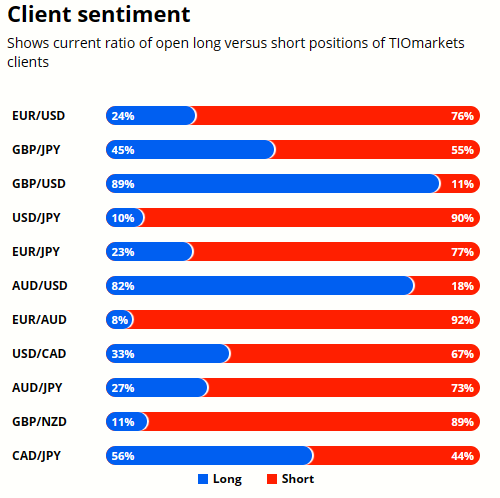
Client sentiment analysis
TIOmarkets clients are mostly bearish on USDCAD with 67% of clients holding short positions and 33% holding long positions in the market.
Please remember that the retail trader client sentiment is a contrarian indicator as most of the retail traders are on average betting against the market trends. This is why, experienced traders tend to trade against the retail client sentiment. You can follow the TIOmarkets client sentiment live on our Forex dashboard.
The Next Key Risk Events
- Canadian GDP
- U.S. Employment Cost Index
- U.S. CB Consumer Confidence
- U.S. ISM Manufacturing PMI
- The Fed Rate Decision
Potential USDCAD market moves
If the USDCAD maintains support at 1.3796 and attracts buyers, the 20-period moving average's bullish tilt could propel the pair to retest the 1.3880 resistance. Combined with the bullish daily moving averages, an upward breakout is possible, targeting the 1.3977 weekly resistance.
Alternatively, The bearish wedge on the daily chart hints at potential downside. Should USDCAD decisively break 1.3796, the pair might tumble to 1.3740 or even 1.3569. With the stochastic oscillator overbought and weekly resistance looming, a drop towards Fibonacci levels 1.3395-1.3485 is plausible.
How would you trade USDCAD today?
I hope this fundamental and technical USDCAD analysis helps you make better informed trading decisions. Check the latest market analysis for other instruments and subscribe to receive them in your inbox as soon as they are published
DISCLAIMER: TIO Markets offers an exclusively execution-only service. The views expressed are for information purposes only. None of the content provided constitutes any form of investment advice. The comments are made available purely for educational and marketing purposes and do NOT constitute advice or investment recommendation (and should not be considered as such) and do not in any way constitute an invitation to acquire any financial instrument or product. TIOmarkets and its affiliates and consultants are not liable for any damages that may be caused by individual comments or statements by TIOmarkets analysis and assumes no liability with respect to the completeness and correctness of the content presented. The investor is solely responsible for the risk of his/her investment decisions. The analyses and comments presented do not include any consideration of your personal investment objectives, financial circumstances, or needs. The content has not been prepared in accordance with any legal requirements for financial analysis and must, therefore, be viewed by the reader as marketing information. TIOmarkets prohibits duplication or publication without explicit approval.

Janne Muta holds an M.Sc in finance and has over 20 years experience in analysing and trading the financial markets.
Related Posts


Trade responsibly: CFDs are complex instruments and come with a high risk of losing all your invested capital due to leverage.