USDCAD Analysis | BoC drops the language about rate hikes
BY Janne Muta
|January 25, 2024USDCAD Analysis - The Bank of Canada maintained its overnight rate at 5% in January 2024, marking the fourth consecutive decision and keeping borrowing costs at a 22-year high. Concerns over rising core inflation led the Governing Council to uphold its restrictive monetary policy, despite a slowdown in economic activity.
The bank anticipates headline inflation to hover around 3% in H1 2024, gradually reaching the 2% target by 2025. Consumer spending has decreased, business investment contracted, and the labour market has eased. The decision underscores the bank's commitment to managing inflation risks, even in the face of economic challenges.
Some analysts have highlighted that the recent statement and press conference indicate that Governor Macklem may be lagging in his response to the rapidly slowing Canadian economy. The current 5.00% interest rates are seen as a significant burden on the economy.
Governor Macklem's emphasis on wages and core inflation, which are lagging indicators, could potentially lead to delayed and more forceful actions as economic conditions evolve.
Heads up for the US GDP release today.
Summary of this USDCAD analysis report
- USDCAD rallied strongly yesterday after the BoC dropped a mention of potential rate hikes. If the market can rally decisively above last week's high at 1.3541 our USDCAD analysis suggests a move to 1.3667 could be likely.
- Yesterday's strong momentum candle together with the rising SMA 20 suggests the market could soon break above the 1.3541 resistance level. The market is trading inside a triangle formation which, based on the recent upside momentum, could be resolved to the upside.
- USDCAD lost momentum before it was able to test the 1.3541 high. If this leads to a retracement to the 1.3477 - 1.3492 range we should monitor price action for indications of bulls re-engaging with the market.
Read our full USDCAD analysis report below.
USDCAD Analysis
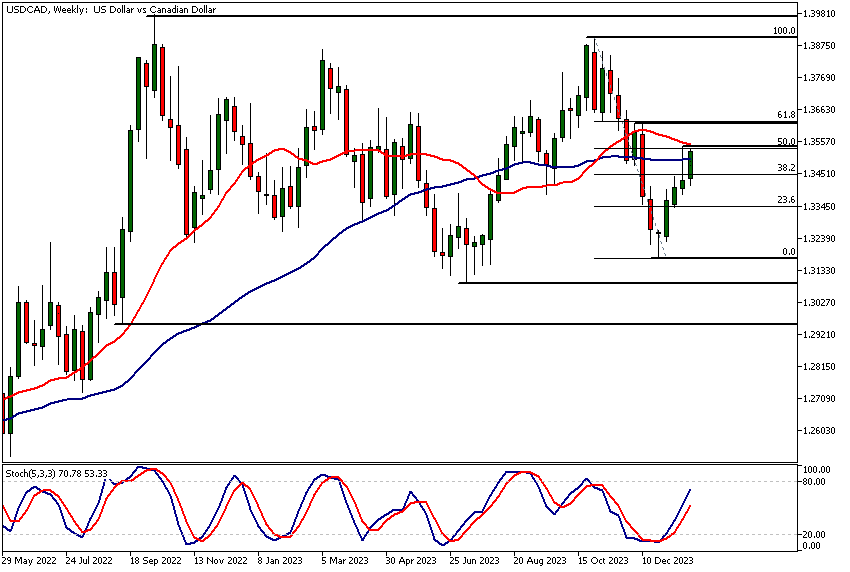
USDCAD Analysis, Weekly
USDCAD rallied strongly yesterday after the BoC dropped a mention of potential rate hikes. If the market can rally decisively above last week's high at 1.3541 our USDCAD analysis suggests a move to 1.3667 could be likely.
The SMA 20 and the 50% Fibonacci retracement levels are closely aligned with the last week's high adding to the technical significance of the 1.3541 level. If the level turns out to be too much for the bulls we might see the market moving down to 1.3360. The next key resistance level above last week's high at 1.3619 coincides with the 61.8% retracement level.
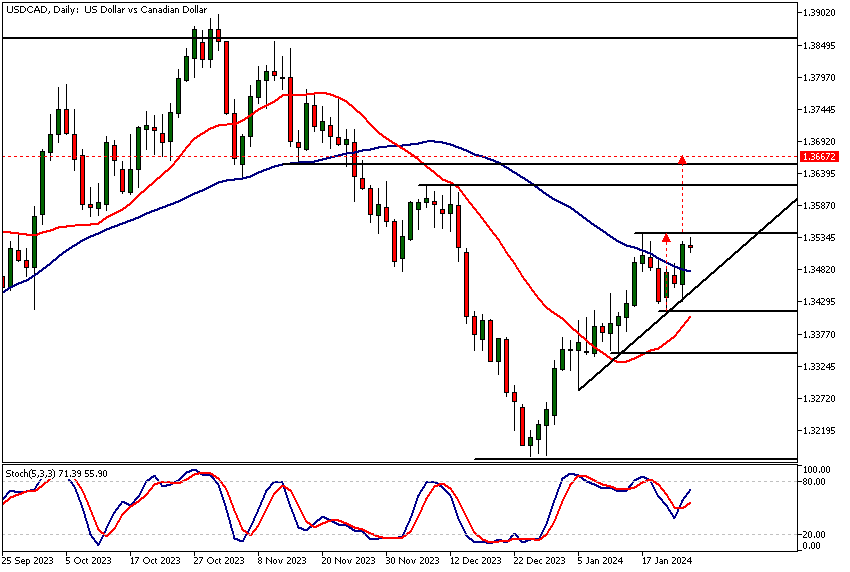
USDCAD Analysis, Daily
Yesterday's strong momentum candle together with the rising SMA 20 suggests the market could soon break above the 1.3541 resistance level. The market is trading inside a triangle formation which, based on the recent upside momentum, could be resolved to the upside.
USDCAD analysis shows the market attracting buyers each time the rising trend line support is tested. This has resulted in the SMA 20 pointing higher which could encourage buying from algorithmic trading models. Yesterday the stochastic oscillator gave a buy signal possibly encouraging indicator followers to buy the market.
The market remains bullish above 1.3415 and could be targeting 1.3667 (a measured move target). Alternatively, below 1.3415 look for a move to 1.3360.
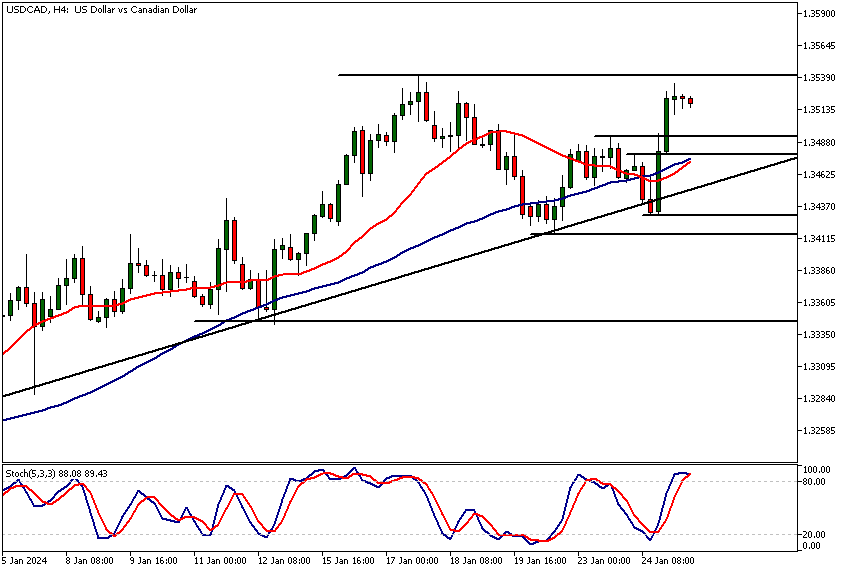
Intraday USDCAD Analysis
USDCAD lost momentum before it was able to test the 1.3541 high. If this leads to a retracement to the 1.3477 - 1.3492 range we should monitor price action for indications of bulls re-engaging with the market.
Moving averages-based USDCAD analysis supports a bullish view on the market as both the SMA 20 and the SMA 50 point higher. Stochastic oscillator though has started to contract as it reacts to the slight loss of upside momentum over the last two to three 4h price candles.
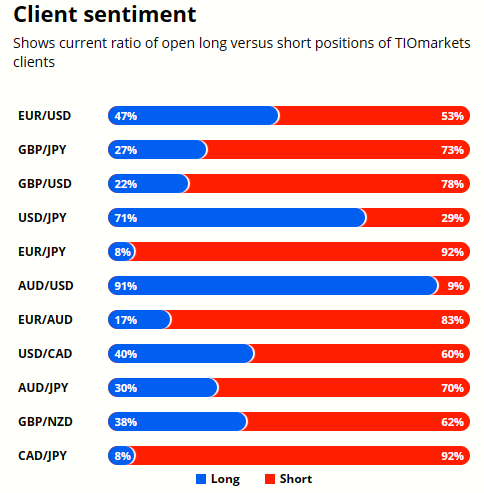
Client sentiment analysis
40% of clients trading USDCAD are holding long positions, while 60% are holding short positions. Client sentiment data is being provided by TIO Markets Ltd.
Please note that retail client trading sentiment is often said to be a contrarian indicator. This is because trade data suggests that private (non-professional) traders, on average, trade against market price trends. You can follow the TIOmarkets client sentiment live on our Forex dashboard.
The Next Key Risk Events
- USD - Advance GDP q/q
- USD - Unemployment Claims
- USD - Advance GDP Price Index q/q
- USD - Core Durable Goods Orders m/m
- USD - Durable Goods Orders m/m
- USD - New Home Sales
- USD - Core PCE Price Index m/m
- USD - Pending Home Sales m/m
Potential USDCAD market moves
Yesterday the stochastic oscillator gave a buy signal possibly encouraging indicator followers to buy the market. The market remains bullish above 1.3415 and could be targeting 1.3667 (a measured move target). Alternatively, below 1.3415 look for a move to 1.3360.

How Would You Trade USDCAD Today?
I hope this fundamental and technical USDCAD analysis helps you make better informed trading decisions. Check the latest market analysis for other instruments and subscribe to receive them in your inbox as soon as they are published
DISCLAIMER: TIO Markets offers an exclusively execution-only service. The views expressed are for information purposes only. None of the content provided constitutes any form of investment advice. The comments are made available purely for educational and marketing purposes and do NOT constitute advice or investment recommendation (and should not be considered as such) and do not in any way constitute an invitation to acquire any financial instrument or product. TIOmarkets and its affiliates and consultants are not liable for any damages that may be caused by individual comments or statements by TIOmarkets analysis and assumes no liability with respect to the completeness and correctness of the content presented. The investor is solely responsible for the risk of his/her investment decisions. The analyses and comments presented do not include any consideration of your personal investment objectives, financial circumstances, or needs. The content has not been prepared in accordance with any legal requirements for financial analysis and must, therefore, be viewed by the reader as marketing information. TIOmarkets prohibits duplication or publication without explicit approval.

Janne Muta holds an M.Sc in finance and has over 20 years experience in analysing and trading the financial markets.
Related Posts


Trade responsibly: CFDs are complex instruments and come with a high risk of losing all your invested capital due to leverage.