USDCAD Analysis | CAD strengthens on strong data and Fed rate cut bets
BY Janne Muta
|November 29, 2023USDCAD Analysis - The recent weakness in the USDCAD currency pair in November can be attributed to increased expectations that the Fed is likely to cut interest rates in 2024 and strong economic indicators from Canada.
Yesterday Federal Reserve Governor Christopher Waller suggested extending the pause in rate increases into early next year, pointing to a slowdown in the economy and a decline in inflation. This dovish outlook was echoed by Governor Bowman, who emphasized prioritizing economic growth and employment over low inflation.
On the Canadian side, four key economic indicators have shown strength. The trade surplus for September was remarkably higher than expected, signalling strong foreign exchange inflows and a robust export sector.
Additionally, October’s employment data outperformed forecasts, indicating a resilient labour market. Wage growth was also notable, with a 5% increase year-over-year in October, suggesting potential for increased consumer spending.
Lastly, a rebound in retail sales in September further evidences a robust Canadian economy. Traders are now shifting their attention to the upcoming unemployment change report due on Friday. Expectations are leaning towards a slight worsening, with forecasts suggesting an increase to 14.2k from the previous 17.5k. Additionally, the unemployment rate is anticipated to rise marginally by 0.1% to 5.8%.
Summary of this USDCAD analysis report
- The USDCAD has retraced over 2% since the October high and has moved below a key market structure level at 1.3629. The retracement has also brought the pair below the bull channel low. If the weakness continues, we could see the market moving down to 1.3510 and then to 1.3430 on extension.
- In the daily timeframe, USDCAD has moved to levels close to the bear channel low before reacting higher today. Note that the bear channel low coincides with a market structure level at 1.3523. This creates a technical confluence around the 1.3523 level, which adds to the probability of USD shorts being closed at or near this level.
- The recent weakness in the USDCAD currency pair in November can be attributed to increased expectations that the Fed is likely to cut interest rates in 2024 and strong economic indicators from Canada.
Read our full USDCAD analysis report below.
USDCAD Analysis
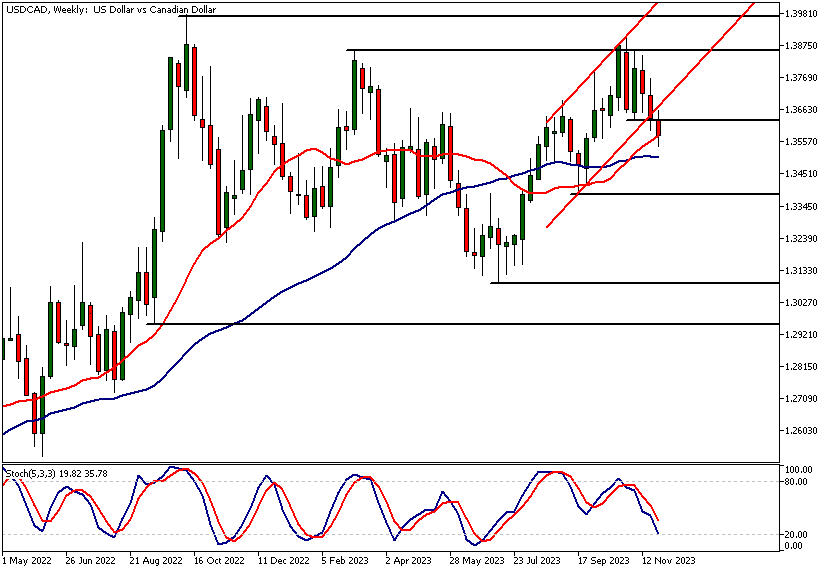
USDCAD Analysis, Weekly
The USDCAD has retraced over 2% since the October high and has moved below a key market structure level at 1.3629. The retracement has also brought the pair below the bull channel low.
Key technical levels
If the weakness continues, we could see the market moving down to 1.3510 and then to 1.3430 on extension. The nearest technical resistances above the current market price are the market structure level at 1.3629 and the bull channel low (currently at 1.3670).
Indicator-based USDCAD analysis indicates that the market is slightly bullish with the SMA(20) pointing higher and above the SMA(50). This contrasts with the price action-based analysis that suggests USDCAD is bearish on the weekly chart.
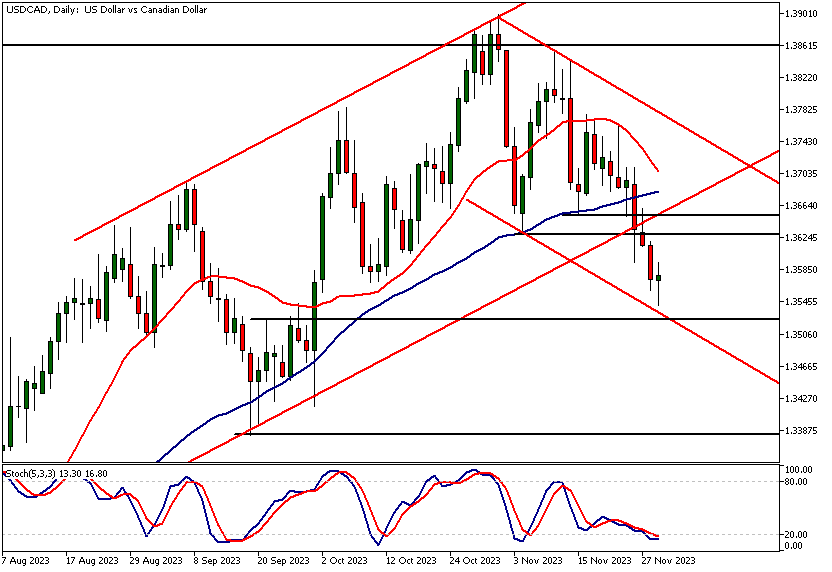
USDCAD Analysis, Daily
In the daily timeframe, USDCAD has moved to levels close to the bear channel low before reacting higher today. Note that the bear channel low coincides with a market structure level at 1.3523.
This creates a technical confluence around the 1.3523 level, which adds to the probability of USD shorts being closed at or near this level. In other words, the market could soon be getting oversold in this timeframe.
Market structure area
Should there be a rally in USDCAD, the market structure area between 1.3629 and 1.3654 could be a major resistance area and possibly targeted by short-term traders. This would potentially bring supply to the market within this market structure area. Alternatively, if the weakness continues, USDCAD analysis indicates a move down to 1.3510 could be likely.
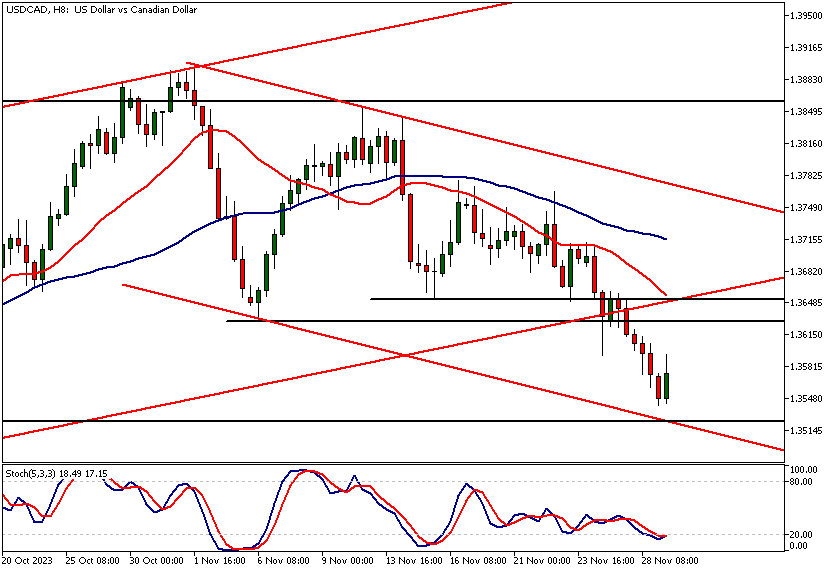
USDCAD Analysis, 8h
The 8-hour chart provides a similar technical picture to the daily timeframe. The market is trending lower, with the 20-period and 50-period moving averages pointing down and with the fast moving average below the slow one. The market has moved higher today, which indicates that a potential counter-trend move could be taking place.
However, USDCAD technical analysis shows how the nearest key resistance area at 1.3629 - 1.3654 is relatively close and could dampen the spirits in the bull camp. Note that traders need to see that the market can provide them with a reasonable profit margin for their trades, and if the nearest resistance area is too close, risk-taking might not be justified. This could lead to further downside movement in the market due to a lack of buyers.
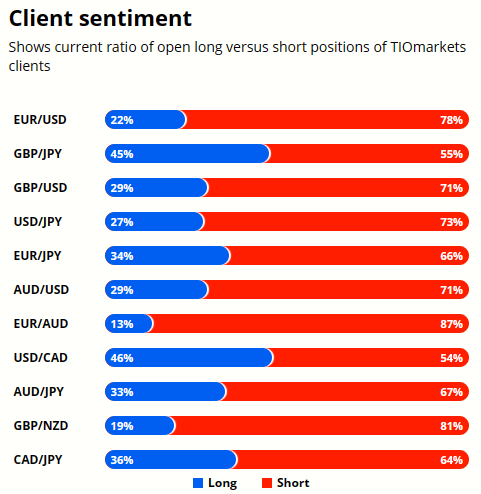
Client sentiment analysis
TIOmarkets clients are almost evenly distributed in terms of longs and shorts with 46% long and 54% short.
Please remember that the retail trader client sentiment is a contrarian indicator as most of the retail traders are on average betting against the market trends. This is why, experienced traders tend to trade against the retail client sentiment. You can follow the TIOmarkets client sentiment live on our Forex dashboard.
The Next Key Risk Events
- USD - Prelim GDP
- USD - Prelim GDP Price Index
- All - OPEC-JMMC Meetings
- CAD - GDP
- USD - Core PCE Price Index
- USD - Unemployment Claims
- USD - Chicago PMI
- USD - Pending Home Sales
- CAD - Employment Change
- CAD - Unemployment Rate
- USD - ISM Manufacturing PMI
- USD - ISM Manufacturing Prices
- USD - Fed Chair Powell Speaks
Potential USDCAD market moves
Should there be a rally in USDCAD, the market structure area between 1.3629 and 1.3654 could be a major resistance area and possibly targeted by short-term traders. This could potentially bring supply to the market within this market structure area. Alternatively, if the weakness continues, USDCAD technical analysis indicates a move down to 1.3510 could be likely.

How would you trade USDCAD today?
I hope this fundamental and technical USDCAD analysis helps you make better informed trading decisions. Check the latest market analysis for other instruments and subscribe to receive them in your inbox as soon as they are published
DISCLAIMER: TIO Markets offers an exclusively execution-only service. The views expressed are for information purposes only. None of the content provided constitutes any form of investment advice. The comments are made available purely for educational and marketing purposes and do NOT constitute advice or investment recommendation (and should not be considered as such) and do not in any way constitute an invitation to acquire any financial instrument or product. TIOmarkets and its affiliates and consultants are not liable for any damages that may be caused by individual comments or statements by TIOmarkets analysis and assumes no liability with respect to the completeness and correctness of the content presented. The investor is solely responsible for the risk of his/her investment decisions. The analyses and comments presented do not include any consideration of your personal investment objectives, financial circumstances, or needs. The content has not been prepared in accordance with any legal requirements for financial analysis and must, therefore, be viewed by the reader as marketing information. TIOmarkets prohibits duplication or publication without explicit approval.

Janne Muta holds an M.Sc in finance and has over 20 years experience in analysing and trading the financial markets.
Related Posts


Trade responsibly: CFDs are complex instruments and come with a high risk of losing all your invested capital due to leverage.