USDCAD Analysis | Canada retail sales hit 11-month peak
BY Janne Muta
|January 22, 2024USDCAD Analysis - USDCAD closed 0.4% lower as Canada's retail sales numbers soared to 11-month highs and US equities rallied strongly, driving the S&P 500 to new highs. The risk-on sentiment put pressure on the dollar, weakening it not only against the CAD but across the board.
Canada's retail sales for December, revealed on Friday, showed a surge of 0.8%, marking the largest increase in 11 months, according to preliminary estimates. This contrasts with the revised 0.2% decrease in November and 0.5% growth in October.
Meanwhile, the US economy demonstrated resilience with a significant drop in initial jobless claims, influencing investor expectations regarding Federal Reserve interest rate cuts. Additionally, US consumer confidence improved in January, with the University of Michigan’s index rising to 78.8 and inflation expectations for the following year decreasing to 2.9%.
Summary of this USDCAD analysis report
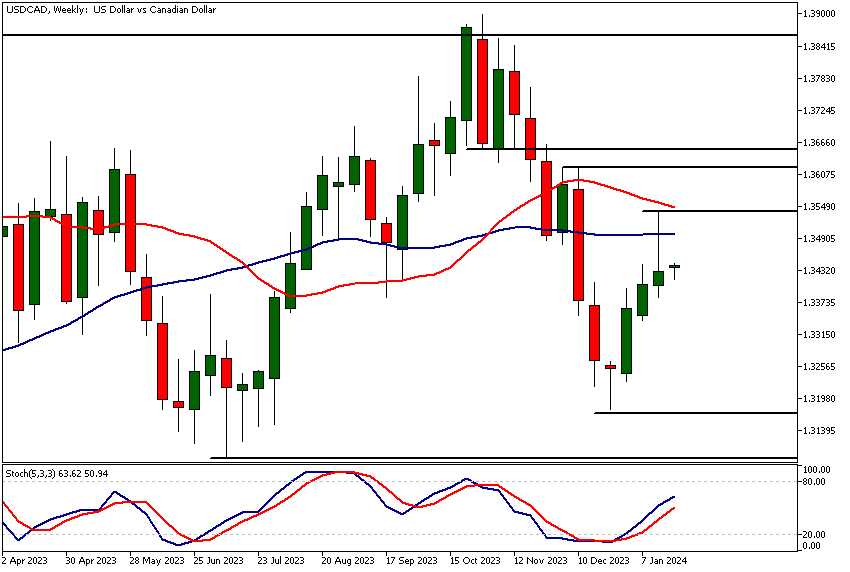
- The bearish rejection candle in the weekly chart suggests further weakness in the USDCAD currency pair. A decisive break below last week's low (1.3380) USDCAD analysis indicates a move down to 1.3280 or so could be likely. Alternatively, above the 1.3380 level, look for a move to the last week's high (1.3541).
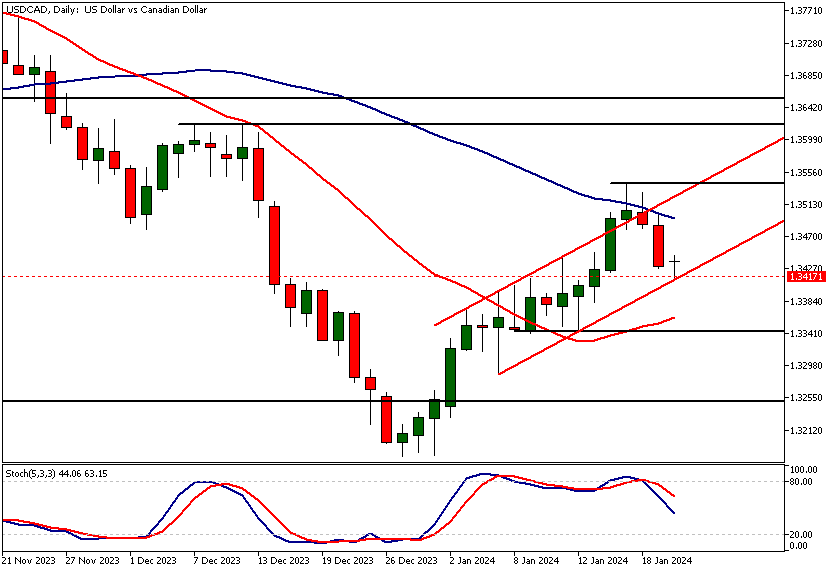
- USDCAD has traded down to a bull channel low. USDCAD analysis shows that this could move the market to the 1.3460 - 1.3480 range. Alternatively, if the channel breaks, a drop to 1.3880 - 1.3400 could be ahead.
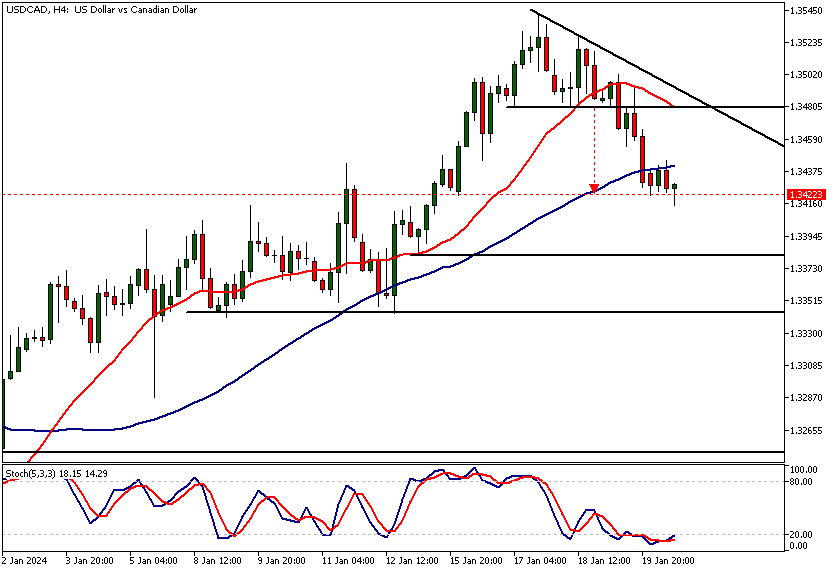
- After a bearish triangle breakout in the 4h chart, the market has now moved to the measured move target. The nearest resistance level is the triangle low at 1.3480. The level is closely aligned with the faster SMA20 that has started to converge towards the slower SMA50. Therefore, technical USDCAD analysis on the 4h chart indicates downside could prevail. The next major support level is at 1.3343 (not far from the SMA20 in the daily timeframe chart).
Read our full USDCAD analysis report below.
USDCAD Analysis
USDCAD Analysis, Weekly
The bearish rejection candle in the weekly chart suggests further weakness in the USDCAD currency pair. The wide range of the candle allows some fluctuation though before a decisive move lower could potentially take place. A decisive break below last week's low (1.3380) USDCAD analysis indicates a move down to 1.3280 or so could be likely. Alternatively, above the 1.3380 level, look for a move to the last week's high (1.3541).
The BOC rate decision (rate: 5%, no change expected) on Wednesday could mean the market moves before it might remain subdued as the market waits for guidance on the future BOC rate policy. The week from Wednesday onwards has several important US data points so most intraday and swing trading opportunities are likely to come during the latter part of the week.
USDCAD Analysis, Daily
USDCAD has traded down to a bull channel low after the market overshot the channel to the upside and created two bearish rejection candles that resulted in a 0.4% fall on Friday.
In today's trading results in a bullish rejection candle, we might see a move higher from the channel low. However, the weekly bearish rejection candles indicates that the risk of potential rallies failing has increased. USDCAD analysis shows that this could move the market to the 1.3460 - 1.3480 range. Alternatively, if the channel breaks, a drop to 1.3880 - 1.3400 could be ahead.
Intraday USDCAD Analysis
After a bearish triangle breakout, the market has now moved to the measured move target. The nearest resistance level is the triangle low at 1.3480. The level is closely aligned with the faster SMA20 that has started to converge towards the slower SMA50.
Therefore, technical USDCAD analysis on the 4h chart indicates downside could prevail. The next major support level is at 1.3343 (not far from the SMA20 in the daily timeframe chart).
The SMA50 (currently at 1.3441) has acted as a dynamic resistance to the market today. If it continues to hold, a move down to 1.3880 - 1.3400 looks likely. Alternatively, above 1.3444 look for a move to 1.3470.
Client sentiment analysis
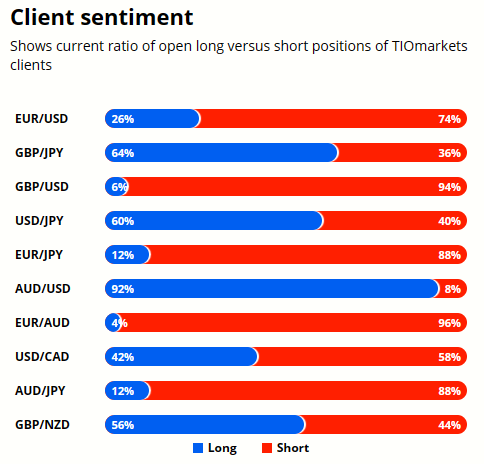
42% of clients trading USDCAD are holding long positions, while 58% are holding short positions. Client sentiment data is being provided by TIO Markets Ltd.
Please note that retail client trading sentiment is often said to be a contrarian indicator. This is because trade data suggests that private (non-professional) traders, on average, trade against market price trends. You can follow the TIOmarkets client sentiment live on our Forex dashboard.
The Next Key Risk Events
- USD - Richmond Manufacturing Index
- CAD - BOC Monetary Policy Report
- CAD - BOC Rate Statement
- CAD - Overnight Rate
- USD - Flash Manufacturing PMI
- USD - Flash Services PMI
- CAD - BOC Press Conference
- USD - Advance GDP q/q
- USD - Unemployment Claims
- USD - Advance GDP Price Index q/q
- USD - Core Durable Goods Orders m/m
- USD - Durable Goods Orders m/m
- USD - New Home Sales
- USD - Core PCE Price Index m/m
- USD - Pending Home Sales m/m
Potential USDCAD market moves
The SMA50 (currently at 1.3441) has acted as a dynamic resistance to the market today. If it continues to hold, a move down to 1.3880 - 1.3400 looks likely. Alternatively, above 1.3444 look for a move to 1.3470.

How Would You Trade USDCAD Today?
I hope this fundamental and technical USDCAD analysis helps you make better informed trading decisions. Check the latest market analysis for other instruments and subscribe to receive them in your inbox as soon as they are published
DISCLAIMER: TIO Markets offers an exclusively execution-only service. The views expressed are for information purposes only. None of the content provided constitutes any form of investment advice. The comments are made available purely for educational and marketing purposes and do NOT constitute advice or investment recommendation (and should not be considered as such) and do not in any way constitute an invitation to acquire any financial instrument or product. TIOmarkets and its affiliates and consultants are not liable for any damages that may be caused by individual comments or statements by TIOmarkets analysis and assumes no liability with respect to the completeness and correctness of the content presented. The investor is solely responsible for the risk of his/her investment decisions. The analyses and comments presented do not include any consideration of your personal investment objectives, financial circumstances, or needs. The content has not been prepared in accordance with any legal requirements for financial analysis and must, therefore, be viewed by the reader as marketing information. TIOmarkets prohibits duplication or publication without explicit approval.

Janne Muta holds an M.Sc in finance and has over 20 years experience in analysing and trading the financial markets.
Related Posts


Trade responsibly: CFDs are complex instruments and come with a high risk of losing all your invested capital due to leverage.