USDCAD Analysis | Market ranges ahead of the FOMC
BY Janne Muta
|December 13, 2023USDCAD Analysis - The CAD has been under pressure recently due to a strengthening USD, as markets have scaled back expectations for a Federal Reserve rate cut. Additionally, falling oil prices have contributed to the Canadian dollar's weakness.
Oil prices have declined due to increased supply signals, including Russia's highest weekly seaborne crude exports since early July. The U.S. Energy Information Administration (EIA) increased its 2023 U.S. crude supply forecast, leading to a 0.2% drop in front-month West Texas Intermediate (WTI) and Brent crude futures.
Stronger-than-expected U.S. inflation data for November has added to market uncertainty, potentially delaying Federal Reserve rate cuts and impacting consumption. Rising Russian crude exports further challenge the recent OPEC+ output cut agreement.
Both Canada and Brazil are ramping up oil production, with Canada expecting a 10% increase next year. Investors are awaiting upcoming monthly market reports from the International Energy Agency (IEA) and OPEC for further insights.
The USD strengthened yesterday as the US Core CPI met expectations, with the November Core CPI, excluding food and energy, increasing by 0.3% month-over-month. The annual core CPI stood at 4%, its lowest since September 2021, aligning with forecasts. Overall, consumer prices rose 0.1% month-over-month due to higher shelter costs and lower gasoline prices, defying expectations of no change, while annual inflation dipped to 3.1% in November, in line with forecasts.
No change is expected in today's Federal Reserve rate meeting. Fed Funds Futures traders are assigning a 98.2% probability to the Fed keeping rates unchanged. For the next year, traders are betting that the Fed will start cutting rates in May, but the probability of a rate cut has decreased from over 80% to 76.2%, following yesterday's firmer-than-expected Core Consumer Price Index (CPI) data.
Summary of this USDCAD analysis report
- Last week, USDCAD moved higher, finding buyers near the 50-day SMA. However, it struggled to surpass the 20-day SMA, leading to a sideways market trend. This movement suggests a mildly bullish outlook but highlights a cautious market awaiting further cues.
- The daily chart shows USDCAD initially rallying, then entering a sideways movement. A pivotal low formed at 1.3544, indicating potential for an upward trend. However, the market's direction remains unclear, highly dependent on the upcoming Federal Reserve commentary and its impact on traders' expectations.
- On the 8-hour chart, USDCAD is trading within a narrow range between 1.3548 and 1.3619, indicating a balanced market sentiment. This sideways pattern suggests market participants are awaiting further information, likely from the FOMC press conference, which could prompt a breakout above or below the current range.
Read our full USDCAD analysis report below.
USDCAD Analysis
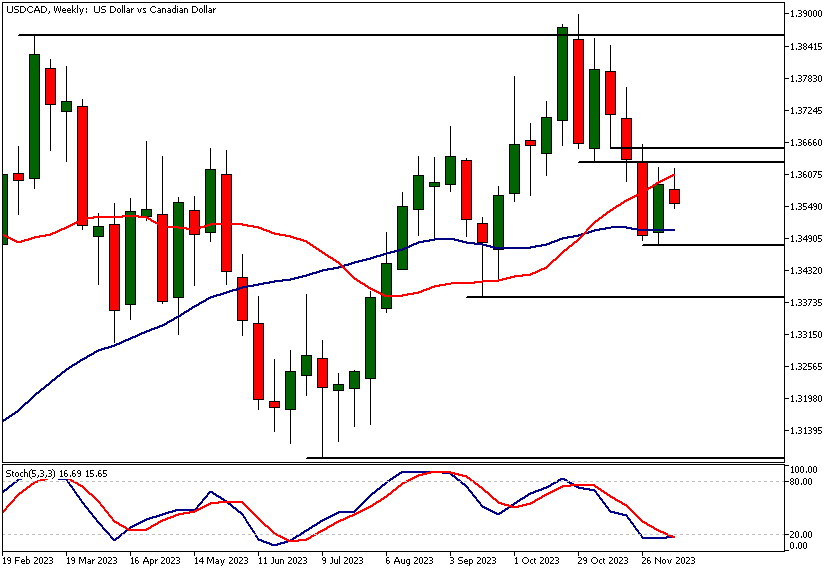
USDCAD Analysis, Weekly
Last week, the USDCAD pair moved higher after attracting buyers near the 50-day Simple Moving Average (SMA), but it lacked sufficient demand to push above the 20-day SMA. The market structure area at 1.3629 - 1.3654 could be why long positions bought a week ago have been at least partially exited. This has resulted in a sideways ranging market on the daily timeframe chart.
The moving averages-based analysis suggests a mildly bullish bias, as the SMA(20) is above the SMA(50) and the slower moving average is moving sideways. Traders are likely waiting for the Federal Open Market Committee (FOMC) press conference for more clues on whether market expectations regarding Fed rate cuts are justified.
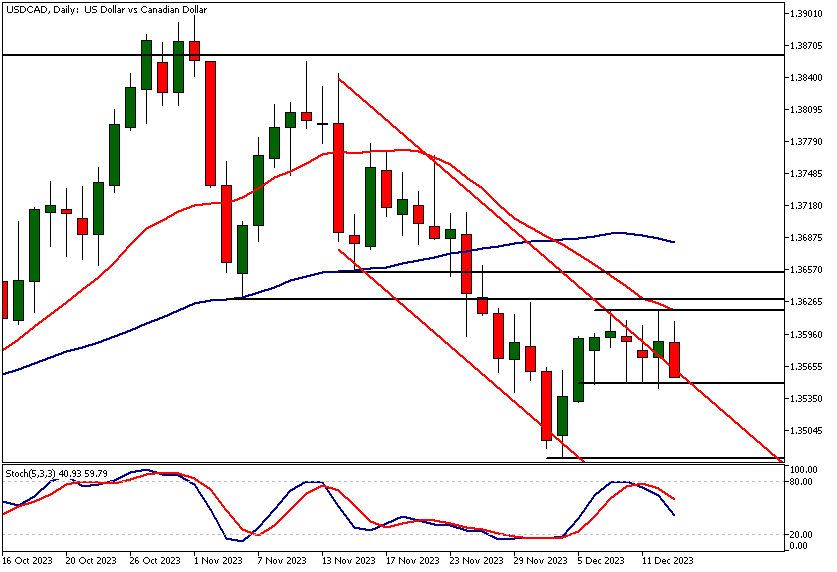
USDCAD Analysis, Daily
The daily chart shows USDCAD moving sideways after an initial two-day rally. The market has potentially formed a range above 1.3544 and is trying to break out of a bearish trend channel.
If bulls have the strength and buying power to push the market higher, we might see USDCAD move through the market structure area (1.3629 - 1.3654) mentioned in the weekly analysis. However, this is speculative, especially as commentary from the Fed could drastically change the probability distribution for future price moves in USDCAD.
Alternative scenario
Alternatively, we could see further consolidation trading within the 1.3548 - 1.3629 range. Or, a decisive break below 1.3544 could drive the market down to 1.3480 and potentially further, but all this depends on the Fed commentary later today and subsequent market reactions.
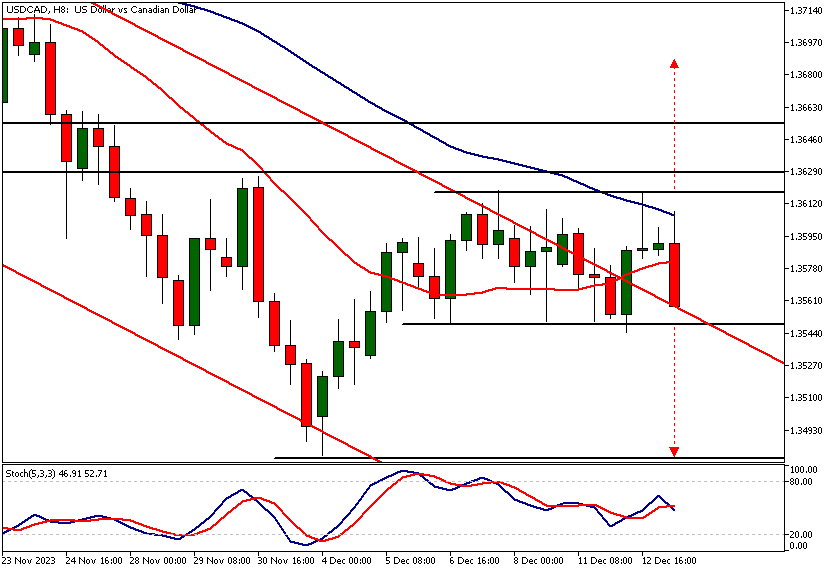
Intraday USDCAD Analysis
The 8-hour chart shows USDCAD moving sideways between the 1.3548 and 1.3619 support and resistance levels. The market briefly moved below this range, but this move was rejected, and the market has since rallied back to the 1.3619 resistance level.
In the process, the market has moved outside the bearish channel but is clearly waiting for further direction from the FOMC press conference today. Sideways ranges commonly indicate that market participants are in relative agreement over the fair value for the currency pair.
Impact of price sensitive data
This is likely to change as soon as more market-moving information becomes available. Therefore, it is certain that the market will break either above or below this sideways range.
Our USDCAD analysis suggests that, based on the current price range, the nearest targets are as follows: on the upside, the measured move target is at 1.3687, and on the downside, the measured move target coincides with the December low at 1.3480.

Client sentiment analysis
68% of clients trading USDCAD are holding long positions, while 32% are holding short positions. Client sentiment data is being provided by TIO Markets Ltd.
It’s good to remember that retail client trading sentiment is a contrarian indicator as most retail traders are on average trading against market price trends. This is why experienced traders tend to trade against the retail client sentiment. You can follow the client sentiment on our Forex dashboard. You can follow the TIOmarkets client sentiment live on our Forex dashboard.
The Next Key Risk Events
- Core PPI m/m
- PPI m/m
- Federal Funds Rate
- FOMC Economic Projections
- FOMC Statement
- FOMC Press Conference
- Core Retail Sales m/m
- Retail Sales m/m
- Unemployment Claims
Potential USDCAD market moves
In the bullish scenario the pair could be breaking through the 1.3629 - 1.3654 market structure area, potentially targeting 1.3687. Conversely, bearish outcomes could involve a decisive break below 1.3544, possibly heading towards the December low at 1.3480.

How Would You Trade USDCAD Today?
I hope this fundamental and technical USDCAD analysis helps you make better informed trading decisions. Check the latest market analysis for other instruments and subscribe to receive them in your inbox as soon as they are published
DISCLAIMER: TIO Markets offers an exclusively execution-only service. The views expressed are for information purposes only. None of the content provided constitutes any form of investment advice. The comments are made available purely for educational and marketing purposes and do NOT constitute advice or investment recommendation (and should not be considered as such) and do not in any way constitute an invitation to acquire any financial instrument or product. TIOmarkets and its affiliates and consultants are not liable for any damages that may be caused by individual comments or statements by TIOmarkets analysis and assumes no liability with respect to the completeness and correctness of the content presented. The investor is solely responsible for the risk of his/her investment decisions. The analyses and comments presented do not include any consideration of your personal investment objectives, financial circumstances, or needs. The content has not been prepared in accordance with any legal requirements for financial analysis and must, therefore, be viewed by the reader as marketing information. TIOmarkets prohibits duplication or publication without explicit approval.

Janne Muta holds an M.Sc in finance and has over 20 years experience in analysing and trading the financial markets.
Related Posts


Trade responsibly: CFDs are complex instruments and come with a high risk of losing all your invested capital due to leverage.