USDCAD Analysis | Strong reversal sent the market higher
BY Janne Muta
|January 3, 2024USDCAD Analysis - In the third quarter of 2023, the US economy exhibited strong growth, the best since Q4 2021, driven by significant consumer spending, especially in services, and investments in both non-residential and residential structures.
This upturn, including an upward revision in government spending, underscores a resilient investment climate. Contrarily, the Canadian economy faced a downturn in the same period, attributed to high interest rates impacting exports (notably in the energy sector) and slowing inventory growth, alongside stagnant consumer spending.
November 2023 saw the US economy add 199K jobs, surpassing the previous month's figures but indicating a slowdown compared to the yearly average. The labour market expects a further slowdown with a predicted increase of 167K jobs in December. Meanwhile, Canada's unemployment rate rose to 5.8%, the highest since January 2022, with a notable impact on the youth demographic.
US core consumer price inflation remained stable at 4% in November 2023, a more than two-year low, with a slight decrease in the shelter index. Canada's inflation rate held steady at 3.1%, higher than expected, driven mainly by increased mortgage interest costs.
In December 2023, the Federal Reserve maintained its funds rate but indicated a potential cut in 2024, with forecasts showing higher GDP growth for 2023, lower inflation rates, and steady unemployment.
Summary of this USDCAD analysis report
- Last week, USDCAD showed a bullish reversal after a decline. A rally towards 1.3480 is possible. The market remains bullish above 1.3177, with potential decline to 1.3120 if this level breaks. Resistance lies between 1.3480 - 1.3494.
- USD CAD rallied after forming a bullish rejection candle. This suggests a bullish trend continuation, targeting resistance at 1.3460 - 1.3480. A momentum failure may lead to a retest of the 1.3178 support level.
- The 8-hour chart shows a breakout from a descending trend channel, approaching resistance at 1.3370. Despite the downward pointing 50-period moving average, the weekly and daily bullish momentum suggest pullbacks might offer buying opportunities.
Read our full USDCAD analysis report below.
USDCAD Analysis
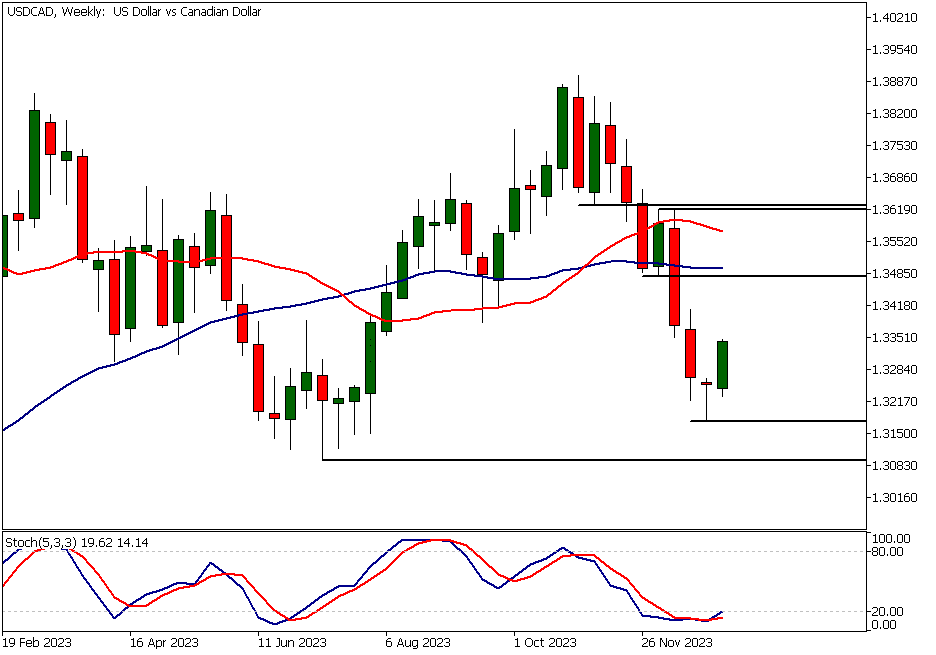
USDCAD Analysis, Weekly
Last week, the USDCAD currency pair formed a bullish rejection candle after a significant decline over the previous two weeks. This bullish signal was followed by a rally this week, suggesting that the market could target the next market structure level at 1.3480. Note that the 50-period moving average is currently at 1.3494. Together, these technical factors form a significant confluence area that might decelerate the market's momentum should it rally to that extent. Our analysis indicates that the market remains bullish above last week's low at 1.3177. Below this level, USDCAD could trade down to 1.3120. The nearest significant resistance area is in the 1.3480 - 1.3494 range.
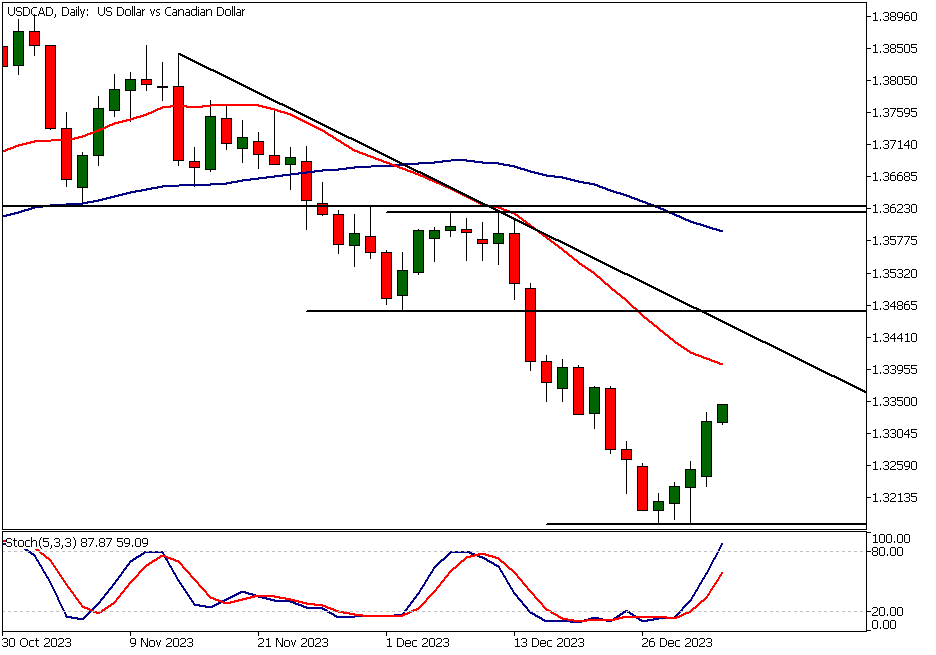
USDCAD Analysis, Daily
Yesterday, USD CAD rallied strongly following a bullish rejection candle formed the day before. Now, the stochastic oscillator has entered the overbought area above 80. However, this indication is unlikely to signal that the market is truly overbought. This is because when the market rises from a support level, it is likely in a bullish up trending context. As more experienced traders can attest, it is quite common for oscillators to be in the overbought territory in up trending markets. The nearest resistance area is created by the downward sloping trendline at 1.3460 and the horizontal resistance at 1.3480. Our analysis indicates that the market could be more likely to trade higher towards the resistance area due to the strong daily momentum. Alternatively, if the momentum fails, look for a retest of the 1.3178 support level.
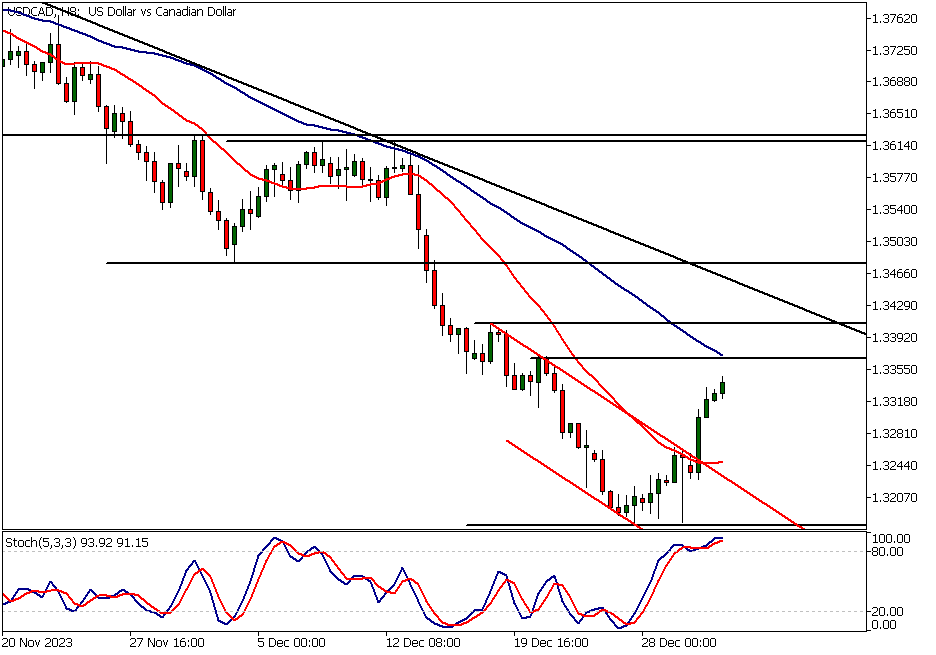
USDCAD Analysis, 8h
The 8-hour chart shows that the market broke out of a descending trend channel yesterday and is now approaching a minor resistance level at 1.3370. This level is closely aligned with the 50-period moving average, which is still pointing lower. However, the strength in the weekly and daily timeframe charts suggests that the bearish indication given by the downward pointing moving average is unlikely to be valid. Instead, potential pullbacks from resistance levels and moving averages might be used as buying opportunities.
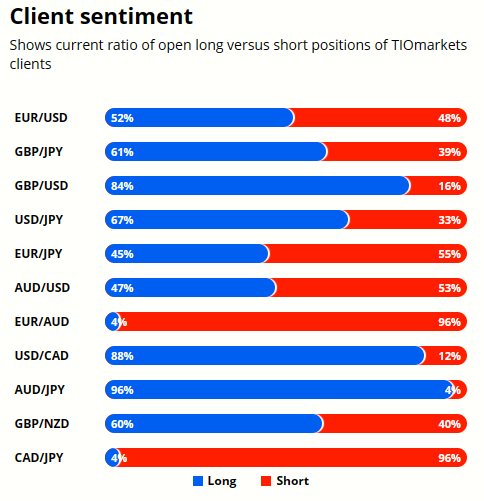
Client sentiment analysis
88% of clients trading USDCAD are holding long positions, while 12% are holding short positions. Client sentiment data is being provided by TIO Markets Ltd.
Please remember that the retail trader client sentiment is a contrarian indicator as most of the retail traders are on average betting against the market trends. This is why, experienced traders tend to trade against the retail client sentiment. You can follow the TIOmarkets client sentiment live on our Forex dashboard.
The Next Key Risk Events
- USD - ISM Manufacturing PMI
- USD - JOLTS Job Openings
- USD - ISM Manufacturing Prices
- USD - FOMC Meeting Minutes
- USD - ADP Non-Farm Employment Change
- USD - Unemployment Claims
- CAD - Employment Change
- CAD - Unemployment Rate
- USD - Average Hourly Earnings m/m
- USD - Non-Farm Employment Change
- USD - Unemployment Rate
- CAD - Ivey PMI
- USD - ISM Services PMI
- USD - FOMC Member Barkin Speaks
Potential USDCAD market moves
Bullish Scenario: USDCAD continues its upward momentum, targeting the resistance area between 1.3480 and 1.3494, supported by the bullish signals on weekly and daily timeframes.
Bearish Scenario: If the bullish momentum fails, USDCAD could fall below the key support level of 1.3177, potentially leading to a decline towards 1.3120. This scenario would be validated by a reversal of the current upward trend.

How would you trade USDCAD today?
I hope this fundamental and technical USDCAD analysis helps you make better informed trading decisions. Check the latest market analysis for other instruments and subscribe to receive them in your inbox as soon as they are published
DISCLAIMER: TIO Markets offers an exclusively execution-only service. The views expressed are for information purposes only. None of the content provided constitutes any form of investment advice. The comments are made available purely for educational and marketing purposes and do NOT constitute advice or investment recommendation (and should not be considered as such) and do not in any way constitute an invitation to acquire any financial instrument or product. TIOmarkets and its affiliates and consultants are not liable for any damages that may be caused by individual comments or statements by TIOmarkets analysis and assumes no liability with respect to the completeness and correctness of the content presented. The investor is solely responsible for the risk of his/her investment decisions. The analyses and comments presented do not include any consideration of your personal investment objectives, financial circumstances, or needs. The content has not been prepared in accordance with any legal requirements for financial analysis and must, therefore, be viewed by the reader as marketing information. TIOmarkets prohibits duplication or publication without explicit approval.

Janne Muta holds an M.Sc in finance and has over 20 years experience in analysing and trading the financial markets.
Related Posts


Trade responsibly: CFDs are complex instruments and come with a high risk of losing all your invested capital due to leverage.