USDCHF Analysis | Dovish Federal Reserve outlook pressures USDCHF
BY Janne Muta
|November 30, 2023USDCHF Analysis - The decline in USDCHF over the last four weeks has been driven by easing inflation and increased expectations that the Federal Reserve will cut rates several times next year. The bond market is moving higher, and as the Wall Street Journal notes, the yield on the 10-year Treasury note continued its downward trend for the third straight day.
This is its lowest point since September, representing a sharp drop from about a month ago when the yield on government bonds reached 5%, a peak not seen in 16 years.
Federal Reserve Governor Christopher Waller recently suggested extending the pause in rate increases into early next year, citing a slowdown in the economy and a decline in inflation. This dovish outlook was echoed by Governor Bowman, who emphasized prioritizing economic growth and employment over low inflation.
As of today's data, Fed Funds Futures traders are pricing in two more rate cuts for 2024. The Federal Reserve is expected to cut rates six times in total before the end of next year, starting in May. Currently, futures traders assign a 76% probability that the first 25 basis point rate cut will occur in May 2024.
Summary of This USDCHF Analysis Report:
- Currently, it is the downside momentum that dominates the weekly chart. Therefore, it might be too early to anticipate a market reversal. However, should there be a contra-trend rally, the key resistance level of 0.8888 might be targeted by traders.
- The daily chart shows that the market has traded close to a key market structure level (support level) at 0.8700. This level was formed in July, first acting as resistance and then as support, propelling the market to a strong move higher. Today the market has been trading higher, suggesting that some traders view the current levels as deeply oversold.
- USDCHF trades inside a bearish trend channel, with the nearest key resistance level at 0.8784. This level coincides with the 50-period moving average and the bear channel top, making it a potential target area for intraday traders (long) and a potential entry level for those looking to short the market. The market remains bearish as per indicator-based USDCHF analysis, with the 20-period SMA below the 50-period SMA.
Read the full USDCHF analysis report below.
USDCHF Analysis
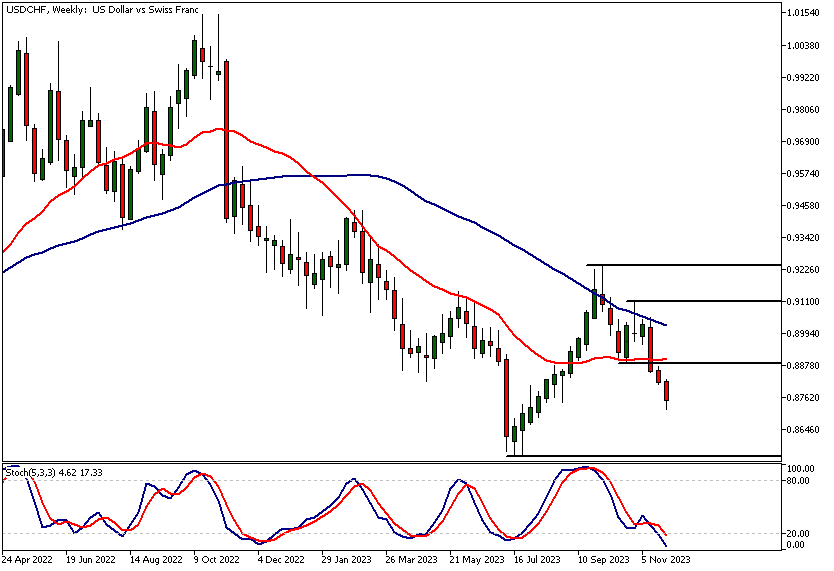
Weekly USDCHF analysis
USDCHF retraced to a technical confluence area around the 50% Fibonacci retracement level before bouncing higher to another confluence area where the 23.6% retracement level and the SMA(50) are closely aligned. The higher swing low at 0.8888 indicates the bulls are willing to step in and buy this market on a pull-back.
The indicator-based USDCHF analysis shows that while the moving averages are still in a bearish order with the SMA(20) below the SMA(50), the fast SMA is moving sideways.
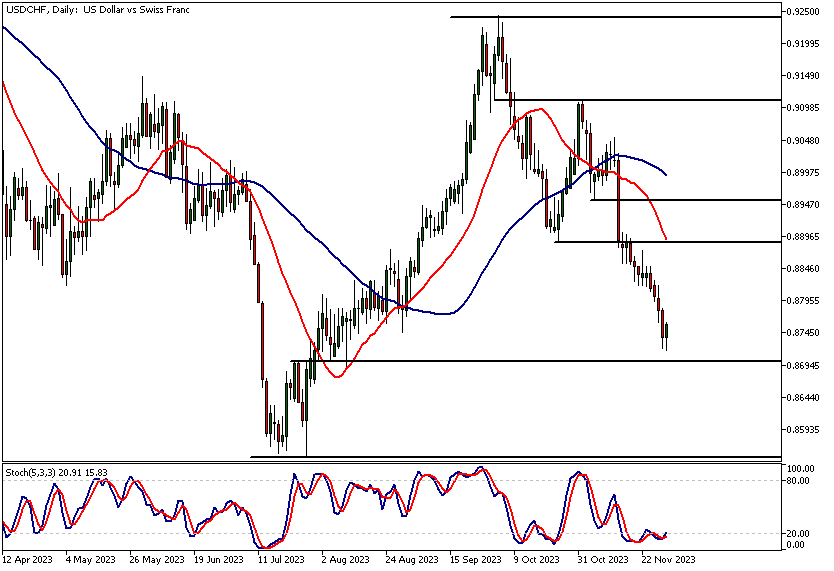
Daily USDCHF analysis
The daily chart shows that the market has traded close to a key market structure level (support level) at 0.8700. This level was formed in July, first acting as resistance and then as support, propelling the market to a strong move higher.
Today the market has been trading higher, suggesting that some traders view the current levels as deeply oversold and therefore today's upward movement could be due to short covering. If there is continued buying, we could see the market trading towards 0.8820. Alternatively, in case there was renewed selling pressure it could push the market down to 0.8700 and then perhaps to 0.8670.
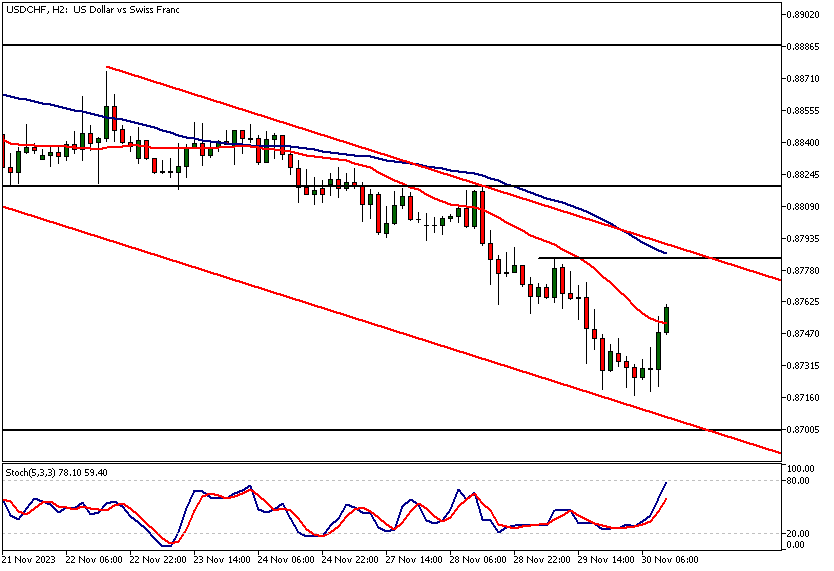
USDCHF analysis, 2h Chart
USDCHF trades inside a bearish trend channel, with the nearest key resistance level at 0.8784. This level coincides with the 50-period moving average and the bear channel top, making it a potential target area for intraday traders (long) and a potential entry level for those looking to short the market.
The market remains bearish as per indicator-based USDCHF analysis, with the 20-period SMA below the 50-period SMA and both moving averages pointing downwards. Note that the stochastic oscillator is close to the overbought territory, but this indication alone isn't a reason to short the market, not even in downtrends.
It makes sense to combine oscillator indications with actual price action signals, as it is the price that moves the indicators and not the other way around.
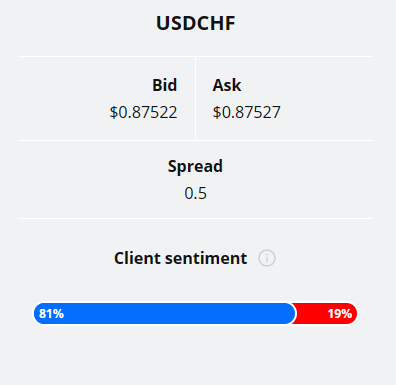
Client sentiment analysis
TIOmarkets' clients are bullish on USDCHF with 81% of them currently holding long positions in the market, while 19% of them are short the market.
Please remember that the retail trader client sentiment is a contrarian indicator as most of the retail traders are on average betting against the market trends. This is why, experienced traders tend to trade against the retail client sentiment. You can follow the TIOmarkets client sentiment live on our Forex dashboard.
The key risk events impacting this market today
- USD - Core PCE Price Index m/m
- USD - Unemployment Claims
- USD - Chicago PMI
- USD - Pending Home Sales m/m
- CHF - GDP
- USD - ISM Manufacturing PMI
- USD - ISM Manufacturing Prices
- USD - Fed Chair Powell Speaks
- USD - Fed Chair Powell Speaks

Potential USDCHF Market Moves
Today the market has been trading higher, suggesting that some traders view the current levels as deeply oversold and therefore today's upward movement could be due to short covering. If there is continued buying, we could see the market trading towards 0.8820. Alternatively, in case there was renewed selling pressure it could push the market down to 0.8700 and then perhaps to 0.8670.
How would you trade the USDCHF today?
I hope this fundamental and USDCHF analysis helps you to make better informed trading decisions. Check the latest market analysis for other instruments and subscribe to receive them in your inbox as soon as they are published
DISCLAIMER: TIO Markets offers an exclusively execution-only service. The views expressed are for information purposes only. None of the content provided constitutes any form of investment advice. The comments are made available purely for educational and marketing purposes and do NOT constitute advice or investment recommendation (and should not be considered as such) and do not in any way constitute an invitation to acquire any financial instrument or product. TIOmarkets and its affiliates and consultants are not liable for any damages that may be caused by individual comments or statements by TIOmarkets analysis and assumes no liability with respect to the completeness and correctness of the content presented. The investor is solely responsible for the risk of his/her investment decisions. The analyses and comments presented do not include any consideration of your personal investment objectives, financial circumstances, or needs. The content has not been prepared in accordance with any legal requirements for financial analysis and must, therefore, be viewed by the reader as marketing information. TIOmarkets prohibits duplication or publication without explicit approval.

Janne Muta holds an M.Sc in finance and has over 20 years experience in analysing and trading the financial markets.
Related Posts


Trade responsibly: CFDs are complex instruments and come with a high risk of losing all your invested capital due to leverage.