USDCHF analysis | Under Pressure After the Fed Rate Decision
BY Janne Muta
|November 2, 2023USDCHF Analysis - USDCHF traded lower yesterday as the 2-year treasury yields dropped following the Fed press conference. The rate cut expectation for the first 25 bp Fed rate cut remained the same though with the markets predicting it to come in June 2024. All in all, the Fed Funds Futures traders expect to see two more 25 bp rate cuts after this.
This morning Switzerland reported the latest inflation data. The Switzerland inflation rate for October y/y remained steady at 1.7%, aligning with market expectations. On a monthly basis, the CPI increased by 0.1%, rebounding from a 0.1% decline in September 2023. Concurrently, the core inflation rate, excluding fluctuating elements like unprocessed food and energy, rose slightly to 1.5% from the previous 1.3%.
Summary of This USDCHF Analysis Report:
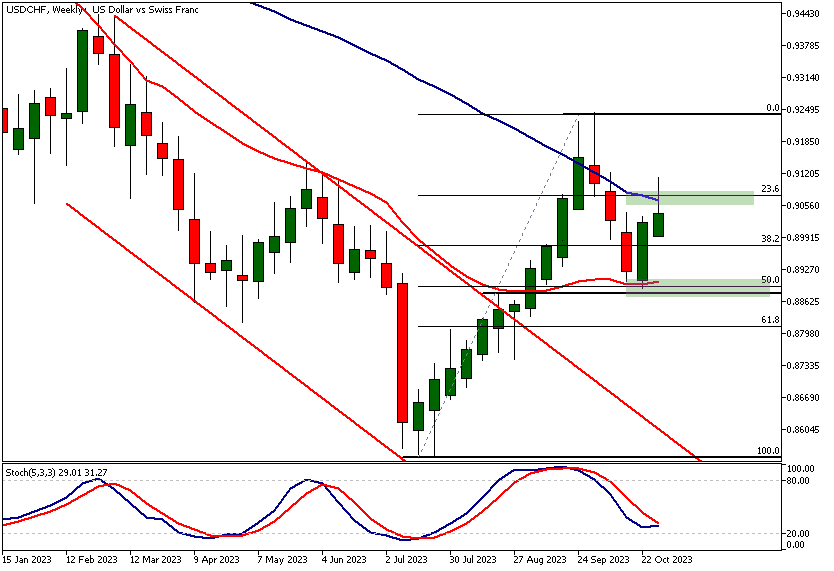
- Weekly Chart: USDCHF hit a 50% Fibonacci level, then rose to a 23.6% level aligned with SMA(50). Despite bearish SMA(50), bullish signs emerge with SMA convergence and the Stochastic Oscillator's upward movement.
- In the daily USDCHF chart, a lower swing high is was established at 0.9112, aligning with a 23.6% retracement. With the Stochastic oscillator overbought and SMA(50) pointing up, a bullish long term bias persists but a corrective more lower is possible.
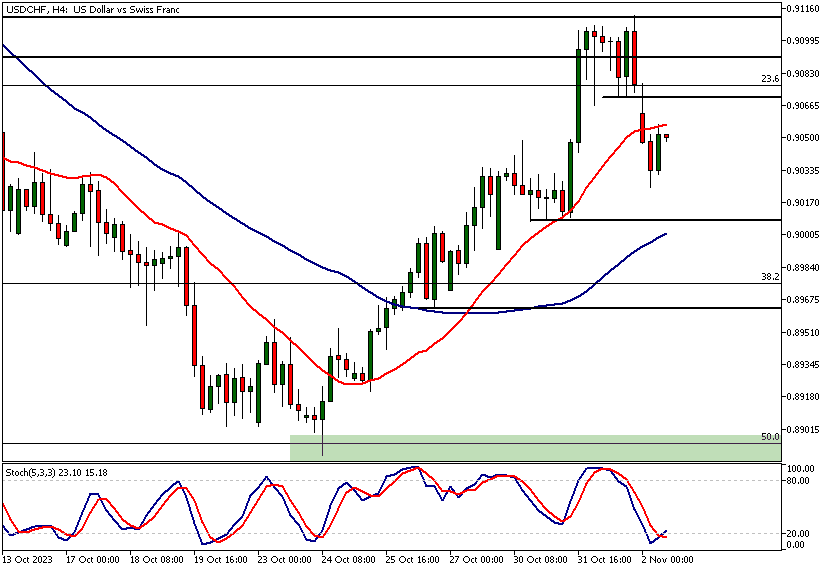
- The 4h USDCHF shows moving averages trending upwards but a failure to surpass 0.9071 might lead to traders targeting the October low.
Read the full USDCHF analysis report below.
USDCHF Analysis
Weekly USDCHF analysis
USDCHF retraced to a technical confluence area around the 50% Fibonacci retracement level before bouncing higher to another confluence area where the 23.6% retracement level and the SMA(50) are closely aligned. The higher swing low at 0.8888 indicates the bulls are willing to step in and buy this market on a pull-back.
The indicator-based USDCHF analysis shows that while the moving averages are still in a bearish order with the SMA(20) below the SMA(50), the fast SMA is moving sideways.
SMA Convergence
This convergence between the moving averages is a bullish indication and is supported by the Stochastic Oscillator line (blue) moving towards the signal line (red). Note also that the SMA(20) supported the market in the latest inflexion point.

Daily USDCHF analysis
In the daily timeframe chart the USDCHF has created a lower swing high at a market structure area (0.9091 - 0.9110) that roughly coincides with the 23.6% retracement level.
The Stochastic oscillator is in the overbought area but the SMA(50) is pointing higher signalling the technical bias is bullish. Therefore, the current down move could be a corrective move lower before the buyers step in again.
For the market to remain bullish in the weekly and daily timeframes the bulls need to start buying again above the latest swing low at 0.8888. Below this level, the technical picture changes and the market could trade down to 0.8745.
USDCHF analysis, 4h Chart
USDCHF retraced back to a sideways move. This retracement has moved the Stochastic oscillator in the oversold area and the latest uptick has resulted in the oscillator giving a buy signal.
Our USDCHF analysis suggests that together with this indication, the moving averages pointing higher and the price trading between the averages the market is bullish above the 0.9010 support level.
However, the bulls need to be able to push USDCHF decisively beyond the 0.9071 level in order to maintain any potential rally. Otherwise, we should look for a move to price levels below the 0.9010 support. A strong break below the level could move the market down to the October low.

Client sentiment analysis
TIOmarkets' clients are bullish on USDCHF with 72% of them currently holding long positions in the market, while 28% of them are short the market.
Please remember that the retail trader client sentiment is a contrarian indicator as most of the retail traders are on average betting against the market trends. This is why, experienced traders tend to trade against the retail client sentiment. You can follow the TIOmarkets client sentiment live on our Forex dashboard.
The key risk events impacting this market today:
- SNB Chairman Jordan Speaks
- US Average Hourly Earnings
- US Non-Farm Employment Change
- US Unemployment Rate
- US ISM Services PMI

Potential USDCHF Market Moves
USDCHF remains bullish above a pivotal price level (0.8888) that aligns with a confluence area near the 23.6% retracement level and the weekly SMA(50). With SMA(20) supporting and the Stochastic Oscillator indicating a buy, a rally above 0.9071 could be likely.
Alternatively, a failure to breach 0.9071 would suggest weakness. If the price drops below 0.9010, a move to the October low (0.8888) looks probable. Below this level, look for a move to 0.8745.,
How would you trade the USDCHF today?
I hope this fundamental and technical USDCHF analysis helps you to make better informed trading decisions. Check the latest market analysis for other instruments and subscribe to receive them in your inbox as soon as they are published
DISCLAIMER: TIO Markets offers an exclusively execution-only service. The views expressed are for information purposes only. None of the content provided constitutes any form of investment advice. The comments are made available purely for educational and marketing purposes and do NOT constitute advice or investment recommendation (and should not be considered as such) and do not in any way constitute an invitation to acquire any financial instrument or product. TIOmarkets and its affiliates and consultants are not liable for any damages that may be caused by individual comments or statements by TIOmarkets analysis and assumes no liability with respect to the completeness and correctness of the content presented. The investor is solely responsible for the risk of his/her investment decisions. The analyses and comments presented do not include any consideration of your personal investment objectives, financial circumstances, or needs. The content has not been prepared in accordance with any legal requirements for financial analysis and must, therefore, be viewed by the reader as marketing information. TIOmarkets prohibits duplication or publication without explicit approval.
Join us on social media

Janne Muta holds an M.Sc in finance and has over 20 years experience in analysing and trading the financial markets.
Related Posts


Trade responsibly: CFDs are complex instruments and come with a high risk of losing all your invested capital due to leverage.