USDJPY Technical Analysis | Bearish channel breakout or trend continuation?
BY Janne Muta
|November 28, 2023USDJPY Technical Analysis - The USDJPY, sensitive to interest rate changes, has been declining over the past two weeks. This downward trend is mainly attributed to growing expectations that the Federal Reserve might implement multiple rate cuts next year.
Traders in Fed funds futures are anticipating as many as four rate reductions in 2024, with the first expected in June. Current futures market data shows a 73,3% likelihood of a rate cut at the Federal Reserve's meeting on June 12, 2024. There's also a 42.5% chance that this cut will be by 25 basis points, potentially lowering the target rate from 525-550 basis points to 500-525 basis points.
The recent weakening of the USD is also linked to market predictions regarding the October Core PCE index, expected to show a 0.2% rise, slightly less than September's figure. Factors such as moderate job growth, resilience in specific retail sectors, declining core inflation, and decreasing energy costs suggest a modest increase in month-over-month PCE growth. This comes despite a small decline in overall retail sales and a general slowdown in the economy.
Summary of This USDJPY Technical Analysis Report:
- The USDJPY uptrend has been ongoing since the March low this year. However, over the past two weeks, the market reacted negatively from the October 2022 high, indicating overwhelming resistance for the bulls.
- The daily chart shows another (smaller) ascending trend channel, but with a bearish breakout. The market formed a lower swing high at 149.75, hinting at a possible further downside before the corrective phase concludes. However, trading near a major weekly resistance level, these corrective moves could morph into trend reversals.
Read the full USDJPY Technical Analysis report below.
USDJPY Technical Analysis
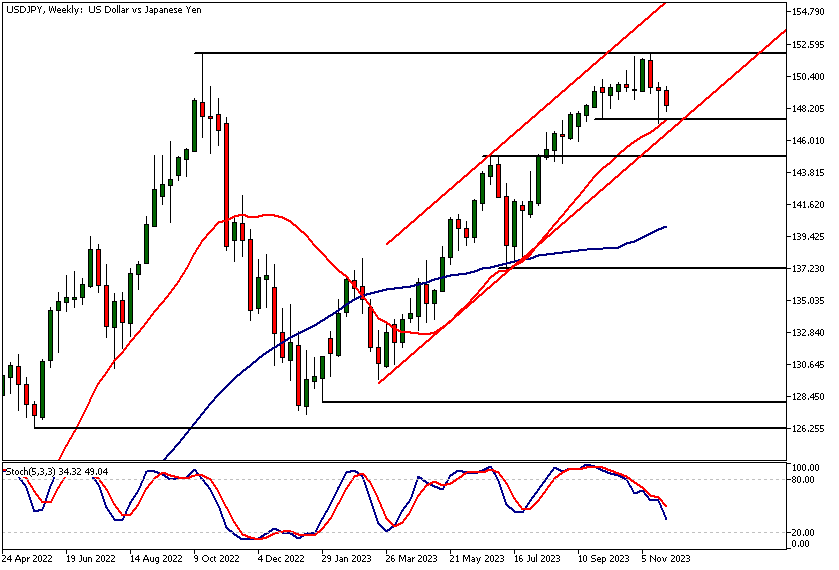
USDJPY Technical Analysis, Weekly Chart
The USDJPY uptrend has been ongoing since the March low this year. However, over the past two weeks, the market reacted negatively from the October 2022 high, indicating overwhelming resistance for the bulls.
Five days ago USDJPY found support at a significant market structure level (147.43), closely aligned with the 20-period moving average.
Bearish scenario
Additionally, the bull channel's lower boundary is near this level, suggesting limited immediate downside risk. Yet, a break below the bull channel's current low (146.53) could signify an exit from the bullish trend channel, potentially indicating a double top formation on the weekly timeframe. This scenario could lead to a decline towards 145.07, and possibly extend down to around 140.
Indicator-based technical analysis suggests the market remains bullish, with the 20-period moving average trending upwards and well above the 50-period moving average. The stochastic oscillator nearing the oversold area indicates potential exhaustion of the counter-trend retracement.
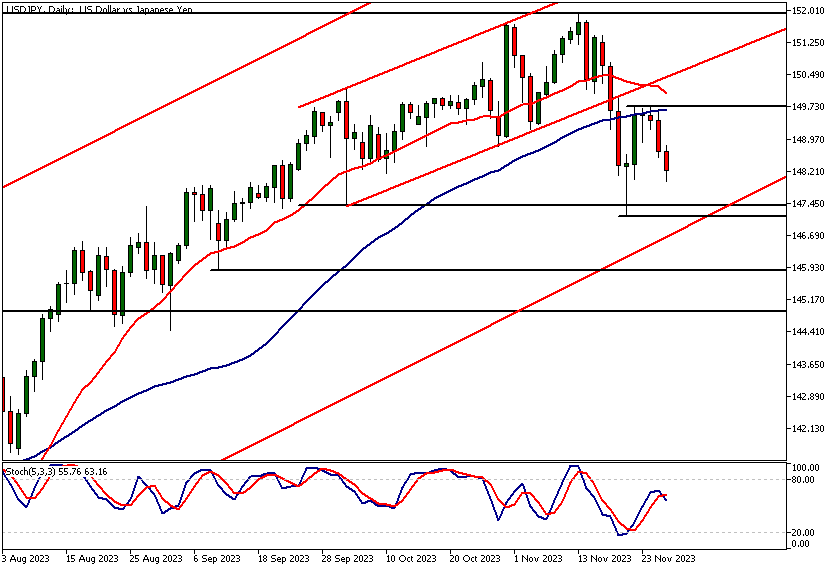
USDJPY Technical Analysis, Daily Chart
The daily chart shows another (smaller) ascending trend channel, but with a bearish breakout. The market formed a lower swing high at 149.75, hinting at a possible further downside before the corrective phase concludes. However, trading near a major weekly resistance level, these corrective moves could morph into trend reversals.
Conversely, there are bullish signs. The rebound from the 147.43 support level five days ago formed a bullish rejection candle, suggesting buying pressure at this level. If the bulls continue defending the 147.43 level and the market breaks above the recent lower swing high at 149.75, we could see an approach towards the lower boundary of the smaller ascending trend channel (currently at 150.42).
Potential target levels
Alternatively, a decisive break below the 147.15 low created five days ago might lead to a decline towards 145.90. Overall, our USDJPY technical analysis indicates deteriorating market conditions, with the 20-period moving average converging towards the 50-period moving average and the market trading below the 50-period SMA.
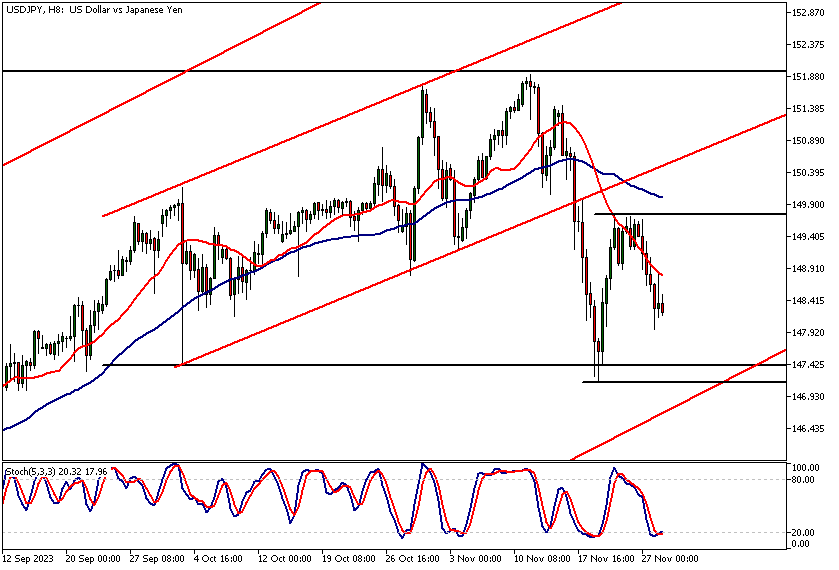
USDJPY Technical Analysis, 8h Chart
The 8-hour chart presents a similar technical picture to the daily timeframe. The main difference is the bearish alignment of moving averages, with the 20-period moving average trending below the 50-period SMA, signaling a possible trend change in USDJPY. Indicator-based technical analysis shows mixed signals, with moving averages in a bearish configuration and the stochastic oscillator in the oversold area.
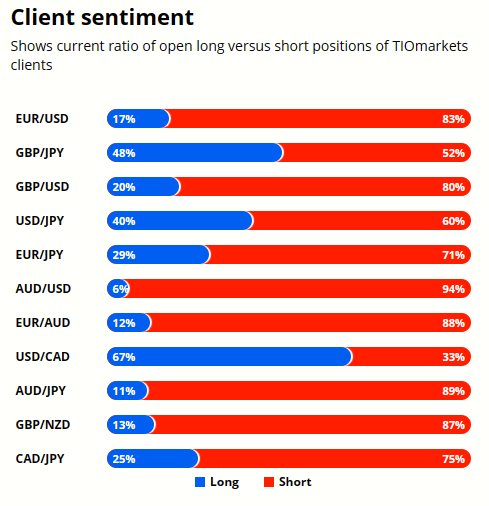
Client sentiment analysis
TIOmarkets clients are slightly bearish on USDJPY with 60% of clients holding short positions and 40% holding long positions in the market.
Please remember that the retail trader client sentiment is a contrarian indicator as most of the retail traders are on average betting against the market trends. This is why, experienced traders tend to trade against the retail client sentiment. You can follow the TIOmarkets client sentiment live on our Forex dashboard.
The next key risk events impacting this market
- US FOMC Member Waller Speaks
- US Prelim GDP
- US Prelim GDP Price Index
- US Core PCE Price Index m/m
- US Unemployment Claims
- US Chicago PMI
- US Pending Home Sales
- US ISM Manufacturing PMI
- US ISM Manufacturing Prices
- US Fed Chair Powell Speaks
Potential USDJPY Market Moves
If the bulls continue defending the 147.43 level and the market breaks above the recent lower swing high at 149.75, we could see an approach towards the lower boundary of the smaller ascending trend channel (currently at 150.42).
Alternatively, a decisive break below the 147.15 low created five days ago might lead to a decline towards 145.90.

How would you trade the USDJPY today?
I hope this USDJPY technical analysis helps you to make better informed trading decisions. Check the latest market analysis for other instruments and subscribe to receive them in your inbox as soon as they are published
DISCLAIMER: TIO Markets offers an exclusively execution-only service. The views expressed are for information purposes only. None of the content provided constitutes any form of investment advice. The comments are made available purely for educational and marketing purposes and do NOT constitute advice or investment recommendation (and should not be considered as such) and do not in any way constitute an invitation to acquire any financial instrument or product. TIOmarkets and its affiliates and consultants are not liable for any damages that may be caused by individual comments or statements by TIOmarkets analysis and assumes no liability with respect to the completeness and correctness of the content presented. The investor is solely responsible for the risk of his/her investment decisions. The analyses and comments presented do not include any consideration of your personal investment objectives, financial circumstances, or needs. The content has not been prepared in accordance with any legal requirements for financial analysis and must, therefore, be viewed by the reader as marketing information. TIOmarkets prohibits duplication or publication without explicit approval.

Janne Muta holds an M.Sc in finance and has over 20 years experience in analysing and trading the financial markets.
Related Posts


Trade responsibly: CFDs are complex instruments and come with a high risk of losing all your invested capital due to leverage.