USDJPY Technical Analysis | Bullish Wedge Breakout
BY Janne Muta
|January 4, 2024USDJPY Technical Analysis - The USDJPY pair strengthened after the Federal Open Market Committee (FOMC) minutes were released, despite a slight drop in Treasury yields. Currently, the Fed Funds futures market anticipates five 25 basis point rate cuts this year, starting in March, with a 72.6% likelihood of a rate cut in March and a 66.5% chance it will be 25 basis points.
At the December Federal Reserve meeting, discussions focused on the economy's resilience to high interest rates and the possibility of pausing the reduction of the Fed's balance sheet. Chairman Jerome Powell hinted at ending rate hikes and possibly reducing borrowing costs by late 2024. The minutes showed confidence in managing inflation but cautioned against excessively strict policies harming the economy.
Inflation threats seem to be diminishing, with the core PCE index nearing the Fed's 2% target. Reduced references to inflation as "unacceptably high" suggest a continued decline. However, tight monetary policy remains vital to suppress demand, though geopolitical uncertainties and balancing inflation control with high employment rates present challenges.
The Federal Reserve is considering reversing policies that may affect economic activity, like ending quantitative tightening amid volatile financial markets. While this could stimulate growth by lowering borrowing costs, it risks reigniting inflation, complicating the balance between fostering growth and maintaining monetary stability. Ending quantitative tightening might lead to lower Treasury bond yields and a weaker USD, as bond demand falls.
Summary of This USDJPY Technical Analysis Report:
- USDJPY has shown strong bullish momentum this week, surpassing the previous week's high. The market's rebound from the 50-period moving average with the strong momentum maintained above last week’s high suggests more upside in this market. The next major weekly resistance is at the 20-period moving average around 147.43.
- The market has broken above the descending trend channel in the daily chart, indicating potential further gains for USDJPY, targeting the daily resistance at 144.95. Despite bearish moving averages, current price action suggests bullish sentiment. A failure to maintain momentum could lead to a decline towards 142.20
- On the 2-hour chart, USDJPY is trending upwards with key support at 142.85, reinforced by the 20-period moving average. A secondary support level at 142.20, aligning with the descending channel high, could play a crucial role if a retracement occurs.
Read the full USDJPY Technical Analysis report below.
USDJPY Technical Analysis
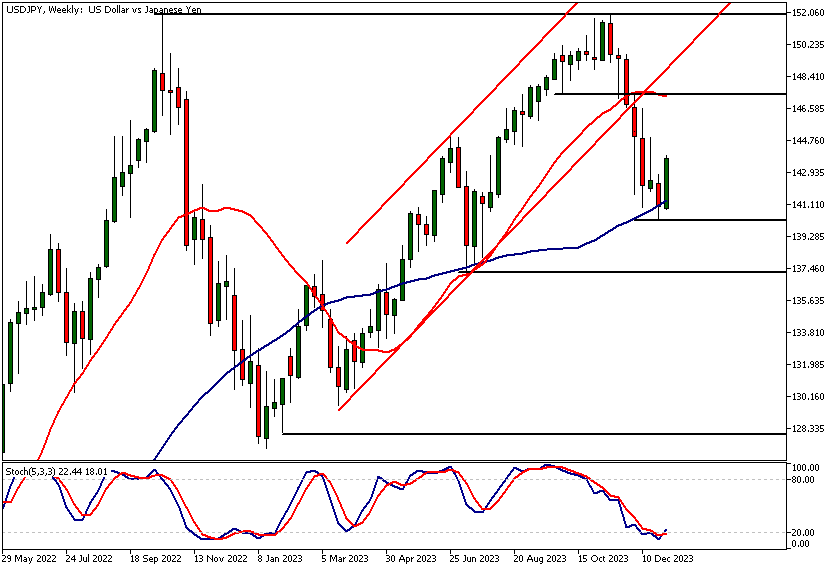
USDJPY Technical Analysis, Weekly Chart
USDJPY has rallied strongly this week, currently trading above the previous week's high, signalling strength. The market is bouncing higher from the 50-period moving average after a significant decline in the preceding weeks.
This market reversal increases the probability of USDJPY trading higher over the coming days, and perhaps even weeks. The next significant resistance is formed by the 20-period moving average and a horizontal resistance level at 147.43. On the weekly chart, the market remains bullish above last week's low of 140.25 and could be heading towards the 147.43 resistance level.
Alternatively, USDJPY technical analysis suggests that below 140.25, we could see the market trading down to around 138.
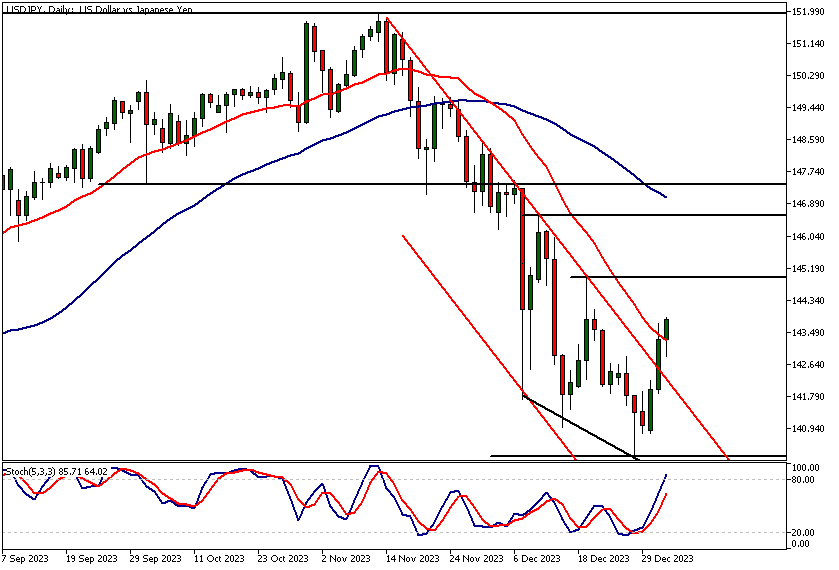
USDJPY Technical Analysis, Daily Chart
After forming a bullish wedge, the market broke above the descending trend channel high yesterday. This indicates further upside for USDJPY and could take the market to the nearest daily timeframe resistance level at 144.95 and then perhaps to 147.43 or so.
Alternatively, should that upside momentum fail, the market could trade down to 141.80 – 142.20. While the moving averages are still bearish, as they point lower, price action-based USDJPY technical analysis indicates that the market is bullish and could be trading higher.
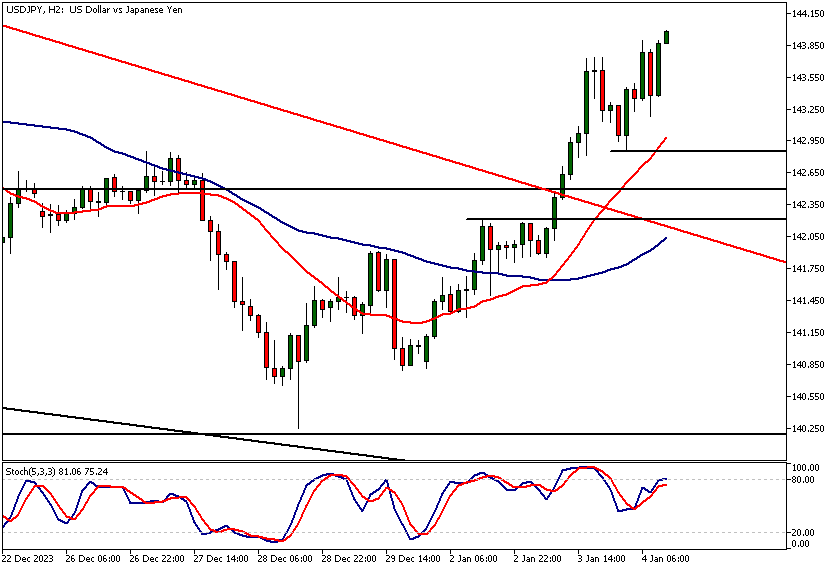
Intraday USDJPY Technical Analysis
The 2-hour chart shows the market trending higher, with the nearest support level at 142.85. Note how the 20-period moving average is closely aligned with this level, creating technical confluence that adds to the technical value of this support level.
The next support level below this, at 142.21, coincides roughly with the descending channel high. This is significant because markets are known to sometimes retrace back to the channel high after a breakout. Therefore, it is worth monitoring price action around this level (142.21) should the market retrace back to it.
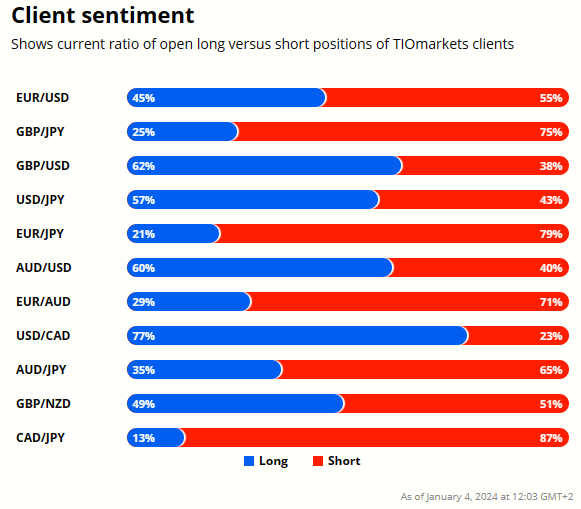
Client sentiment analysis
57% of clients trading USDJPY are holding long positions, while 43% are holding short positions. Client sentiment data is being provided by TIO Markets Ltd.
Please remember that the retail trader client sentiment is a contrarian indicator as most of the retail traders are on average betting against the market trends. This is why, experienced traders tend to trade against the retail client sentiment. You can follow the TIOmarkets client sentiment live on our Forex dashboard.
The next key risk events impacting this market
- USD - ADP Non-Farm Employment Change
- USD - Unemployment Claims
- USD - Average Hourly Earnings m/m
- USD - Non-Farm Employment Change
- USD - ISM Services PMI
- USD - FOMC Member Barkin Speaks
Potential USDJPY Market Moves
USDJPY could extend its gains, targeting 144.95 in the short term and potentially 147.43 in the longer term, bolstered by the market's rebound from key moving averages. Alternatively, a break below 140.25 might initiate a downtrend towards 138, with a shorter-term decline possibly reaching 141.80 if current momentum fails.

How would you trade the USDJPY today?
I hope this USDJPY technical analysis helps you to make better informed trading decisions. Check the latest market analysis for other instruments and subscribe to receive them in your inbox as soon as they are published
DISCLAIMER: TIO Markets offers an exclusively execution-only service. The views expressed are for information purposes only. None of the content provided constitutes any form of investment advice. The comments are made available purely for educational and marketing purposes and do NOT constitute advice or investment recommendation (and should not be considered as such) and do not in any way constitute an invitation to acquire any financial instrument or product. TIOmarkets and its affiliates and consultants are not liable for any damages that may be caused by individual comments or statements by TIOmarkets analysis and assumes no liability with respect to the completeness and correctness of the content presented. The investor is solely responsible for the risk of his/her investment decisions. The analyses and comments presented do not include any consideration of your personal investment objectives, financial circumstances, or needs. The content has not been prepared in accordance with any legal requirements for financial analysis and must, therefore, be viewed by the reader as marketing information. TIOmarkets prohibits duplication or publication without explicit approval.
Join us on social media

Janne Muta holds an M.Sc in finance and has over 20 years experience in analysing and trading the financial markets.
Related Posts


Trade responsibly: CFDs are complex instruments and come with a high risk of losing all your invested capital due to leverage.