USDJPY Technical Analysis | Is the 151.94 too much for the USD bulls?
BY Janne Muta
|November 15, 2023USDJPY Technical Analysis - USDJPY traded sharply lower yesterday after the US CPI came in at lower than expected levels and rallied the bond market. This pushed the yields and the dollar lower against the major currencies, JPY included.
In October, the U.S. annual inflation rate decreased to 3.2%, underperforming forecasts of 3.3%. This reduction was driven by significant declines in energy costs, while food, shelter, and new vehicle prices increased at a slower pace. The core CPI also rose less than expected, both yearly and monthly.
After today's retail sales data release USDJPY bounced higher again after the retail sales data showed weakness after a period of growth. Consumers have so far remained strong but now the October retail sales dipped by 0.1%, marking the first decline since March and indicating a cooling in the US economy.
Read the full USDJPY Technical Analysis report below.
USDJPY Technical Analysis
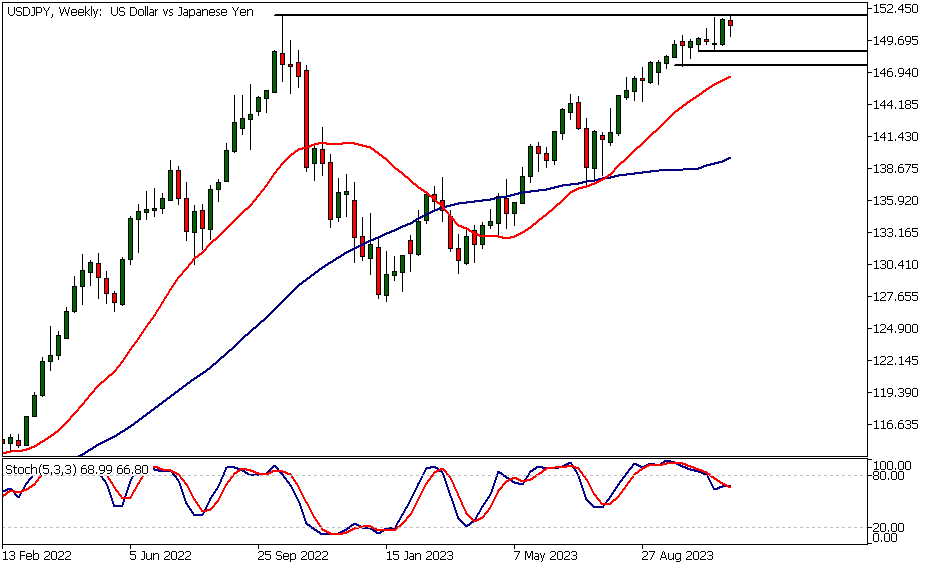
USDJPY Technical Analysis, Weekly Chart
The stochastic oscillator indicates that USDJPY is losing momentum as it trades near the October High at 151.94. At the same time, the moving averages are still pointing higher with the 20-period moving average above the 50 SMA. If the market pulls back from the high, the nearest weekly support levels at 148.80 and 147.42 could come into play.
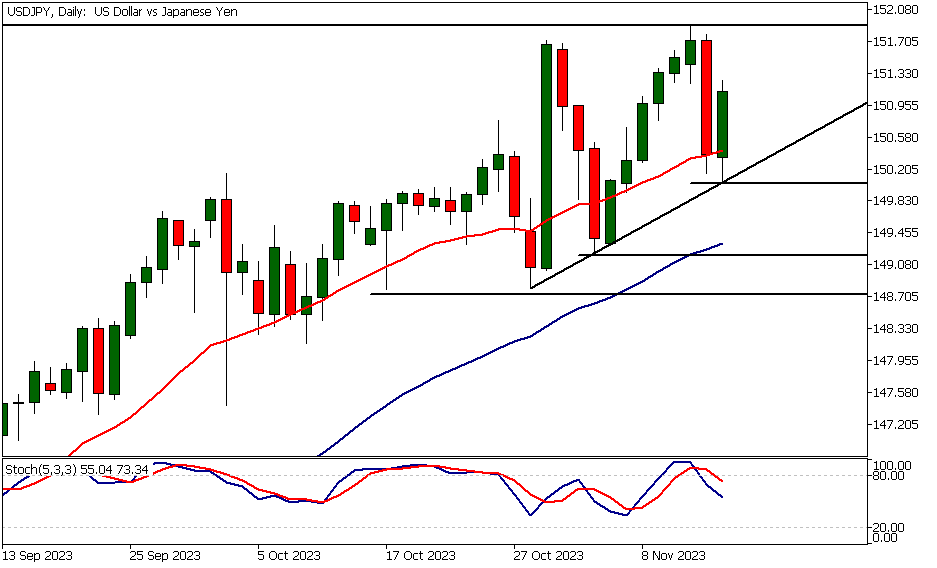
USDJPY Technical Analysis, Daily Chart
The daily USDJPY chart shows the market in an uptrend with the moving averages pointing higher and the fast moving average above the slow. USDJPY technical analysis shows the market trading below the October 2022 high and creating higher daily swing lows fairly close to this level.
The indication is that the bulls are trying to push the market beyond the October 2022 High (151.94). The higher swing lows together with that 151.94 resistance level create a bullish triangle formation.
A measured move target based on the width of the triangle suggests that if the break above 151.94 is decisive, the bulls could be targeting the 154.54 level. Alternatively, if the market fails to attract buyers enough to push it into new highs, we could see further consolidation or a move down to 148.306.
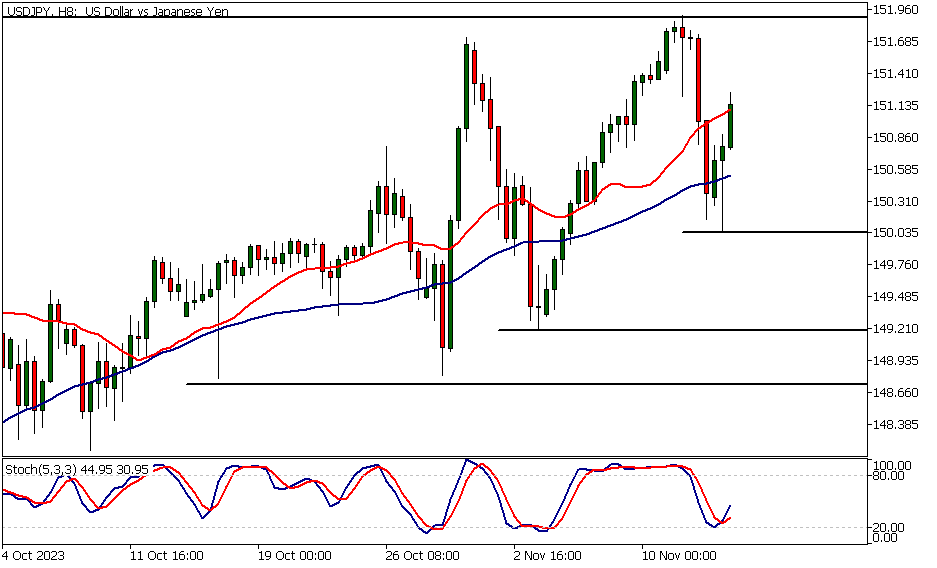
USDJPY Technical Analysis, 8h Chart
The USDJPY currency pair has shown increased volatility in November. Yesterday, the market dropped sharply after the lower-than-expected US CPI reading.
Now, the dollar has caught the bid again, and the USDJPY pair is once again moving towards yesterday's high of 151.90. The nearest key support level on the 8-hour chart is at 150.05. Should the market trade below this level, the next important level to focus on is the highest swing low at 149.19.
Those following indicator-oriented USDJPY technical analysis should notice the moving averages pointing higher, with the 20-period SMA above the 50-period SMA. At the same time, the stochastic oscillator has just given a buy signal.
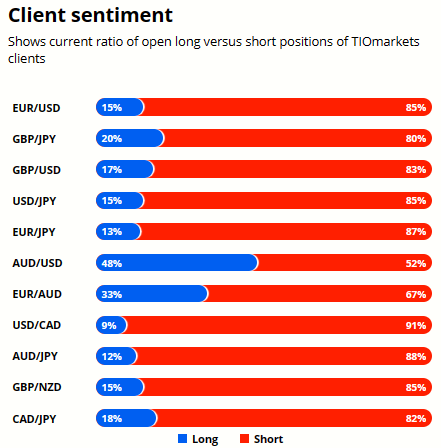
Client sentiment analysis
TIOmarkets clients are bearish on USDJPY with 85% of clients holding short positions and 15% holding long positions in the market.
Please remember that the retail trader client sentiment is a contrarian indicator as most of the retail traders are on average betting against the market trends. This is why, experienced traders tend to trade against the retail client sentiment. You can follow the TIOmarkets client sentiment live on our Forex dashboard.

DISCLAIMER: Tio Markets offers an exclusively execution-only service. The views expressed are for information purposes only. None of the content provided constitutes any form of investment advice. The comments are made available purely for educational and marketing purposes and do NOT constitute advice or investment recommendation (and should not be considered as such) and do not in any way constitute an invitation to acquire any financial instrument or product. TIOmarkets and its affiliates and consultants are not liable for any damages that may be caused by individual comments or statements by TIOmarkets analysis and assumes no liability with respect to the completeness and correctness of the content presented. The investor is solely responsible for the risk of his/her investment decisions. The analyses and comments presented do not include any consideration of your personal investment objectives, financial circumstances, or needs. The content has not been prepared in accordance with any legal requirements for financial analysis and must, therefore, be viewed by the reader as marketing information. TIOmarkets prohibits duplication or publication without explicit approval.

Janne Muta holds an M.Sc in finance and has over 20 years experience in analysing and trading the financial markets.
Related Posts


Trade responsibly: CFDs are complex instruments and come with a high risk of losing all your invested capital due to leverage.