USDJPY Technical Analysis | US CPI release could create high volatility
BY Janne Muta
|January 11, 2024USDJPY Technical Analysis - USDJPY is a rate-sensitive market and as such could see higher volatility today as the US inflation numbers are released. Analysts anticipate a modest rise in the monthly Consumer Price Index (CPI) by 0.2% and Core CPI by 0.3%, with a yearly CPI forecast of 3.2%.
These statistics are pivotal as they may significantly impact the Federal Reserve's future monetary strategies, particularly in adjusting interest rates to manage inflation. Investors are keenly observing these trends, seeking insights into the Fed's next moves—whether to maintain higher rates longer or to implement the anticipated rate cuts.
In December, the Federal Reserve maintained its fed funds rate at 5.25%-5.5% for the third consecutive time. They signalled potential 75bps reductions in 2024. Economic growth has reportedly slowed, with job gains diminishing yet remaining robust. The unemployment rate continues to be low, while inflation, although lower than before, is still significant.
Concurrently, the Bank of Japan held its key short-term interest rate at -0.1% and the 10-year bond yields near 0% in its year-end meeting, as anticipated. Their monetary easing policy remains, with a focus on achieving a 2% inflation target sustainably, alongside wage growth.
Governor Kazuo Ueda noted the lag in wage increases compared to rising prices, questioning the sustainability of the inflation target. Extra easing measures remain on the table if necessary.
Summary of This USDJPY Technical Analysis Report:
- The latest complete weekly candle in USDJPY is bullish, indicating potential upside movement. The market approaches a key structure level at 147.43, reinforced by the 20-period moving average. Moving averages-based analysis shows a bullish trend, with the market rebounding from the 50-period SMA.
- USDJPY recently formed a higher reactionary low at 143.42, suggesting bullish control. A rally could reach 146.70 and possibly 147.50 if momentum continues. These targets align with key market levels and the 61.8 Fibonacci expansion. The 50-period moving average at 146.54 marks the confluence area's lower boundary.
- On the 8-hour chart, USDJPY shows waning momentum, trading near resistance at 145.98. A break above could challenge 146.59. If US inflation exceeds expectations, breaking these levels becomes more feasible. Conversely, falling below 145.28 might push the market towards 144.30 and then possibly to 143.42.
Read the full USDJPY Technical Analysis report below.
USDJPY Technical Analysis

USDJPY Technical Analysis, Weekly Chart
The latest complete weekly candle is a bullish, wide-range one, indicating further upside movement in USDJPY. However, the market is relatively close to a key market structure level at 147.43.
The 20-period moving average closely aligns with this level, enhancing its technical significance. Moving averages-based USDJPY technical analysis still suggests a bullish market, as the averages are bullishly aligned and the market has bounced higher from the 50-period SMA.
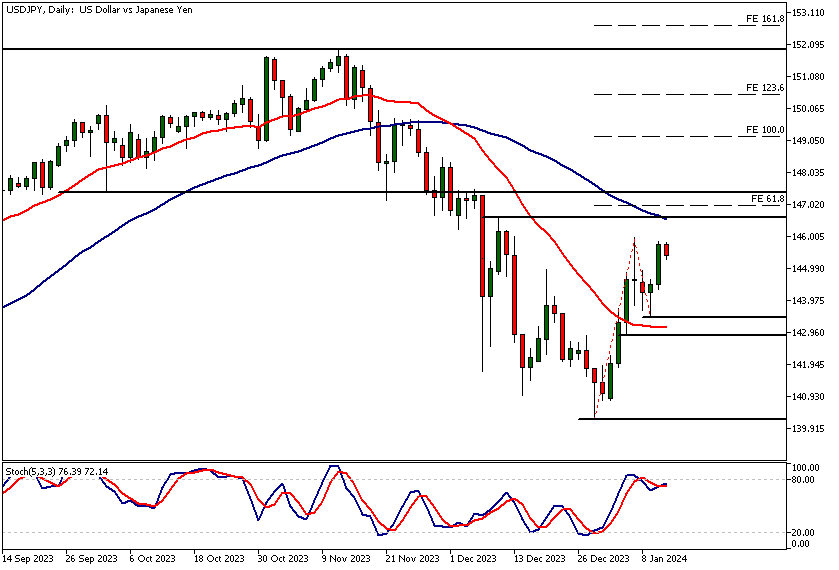
USDJPY Technical Analysis, Daily Chart
USDJPY created a higher reactionary low at 143.42 two days ago. The subsequent rally indicates that the bulls are in control and could drive the market higher to 146.70 and then perhaps to 147.50, if the upside momentum prevails.
These target levels lie within a price range that includes two market structure levels at 146.59 and 147.50. Also, note that the 61.8 Fibonacci expansion target closely aligns with the levels at 147. The 50-period moving average (currently at 146.54) coincides with the lower end of this confluence area.
While price action-based USDJPY technical analysis offers a bullish view of the market, the moving average-based analysis suggests otherwise. The 50-period moving average is still pointing lower, and the market trades below this long-term moving average.
Moving averages are lagging indicators, hence traders would be advised to focus on the price action itself rather than the moving averages. Note also that, should the US inflation numbers come in much lower than anticipated, we could see the market trading lower towards 143.42.
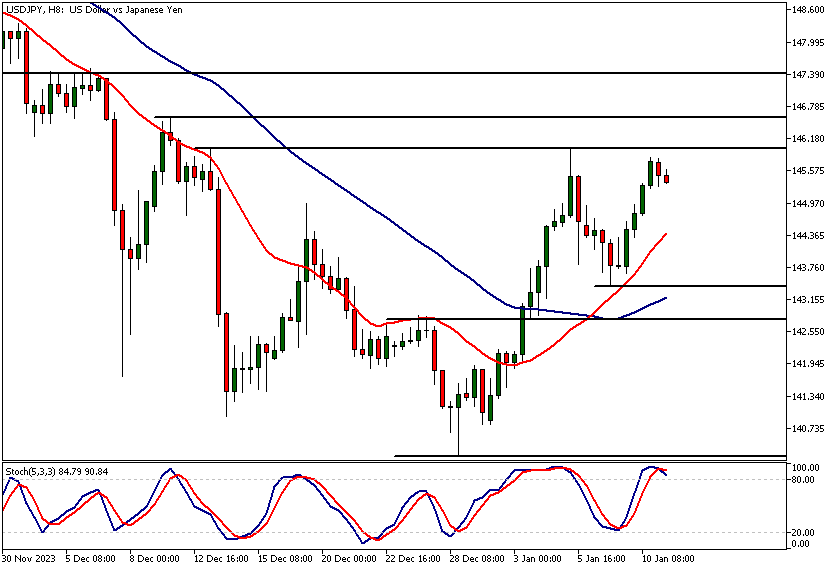
Intraday USDJPY Technical Analysis
The 8-hour chart shows that the market, trading relatively close to a resistance level at 145.98 has lost some momentum today. The next resistance level above this is at 146.59, suggesting that the bulls may have several layers of supply to work through if they wish to drive the market higher.
If the US inflation numbers substantially exceed expectations, it will be easier for the market to push through these levels. Alternatively, USDJPY technical analysis suggests that a decisive break below 145.28 could move the market down to 144.30 and then possibly down to 143.42.
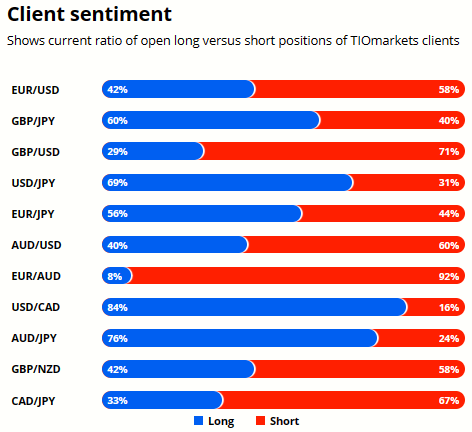
Client sentiment analysis
69% of clients trading USDJPY are holding long positions, while 31% are holding short positions. Client sentiment data is being provided by TIO Markets Ltd.
Please remember that the retail trader client sentiment is a contrarian indicator as most of the retail traders are on average betting against the market trends. This is why, experienced traders tend to trade against the retail client sentiment. You can follow the TIOmarkets client sentiment live on our Forex dashboard.
The next key risk events impacting this market
- USD - Core CPI m/m
- USD - CPI m/m
- USD - CPI y/y
- USD - Unemployment Claims
- USD - 30-y Bond Auction
- USD - Core PPI m/m
- USD - PPI m/m
Potential USDJPY Market Moves
USDJPY could rally to 146.70 and potentially continue higher to 147.50, buoyed by a bullish weekly trend and daily price action. Alternatively, a decline towards 143.42 is possible if US inflation data disappoints, or if the price decisively breaks below key support levels like 145.28, as indicated by intraday analysis.

How would you trade the USDJPY today?
I hope this USDJPY technical analysis helps you to make better informed trading decisions. Check the latest market analysis for other instruments and subscribe to receive them in your inbox as soon as they are published
DISCLAIMER: TIO Markets offers an exclusively execution-only service. The views expressed are for information purposes only. None of the content provided constitutes any form of investment advice. The comments are made available purely for educational and marketing purposes and do NOT constitute advice or investment recommendation (and should not be considered as such) and do not in any way constitute an invitation to acquire any financial instrument or product. TIOmarkets and its affiliates and consultants are not liable for any damages that may be caused by individual comments or statements by TIOmarkets analysis and assumes no liability with respect to the completeness and correctness of the content presented. The investor is solely responsible for the risk of his/her investment decisions. The analyses and comments presented do not include any consideration of your personal investment objectives, financial circumstances, or needs. The content has not been prepared in accordance with any legal requirements for financial analysis and must, therefore, be viewed by the reader as marketing information. TIOmarkets prohibits duplication or publication without explicit approval.

Janne Muta holds an M.Sc in finance and has over 20 years experience in analysing and trading the financial markets.
Related Posts


Trade responsibly: CFDs are complex instruments and come with a high risk of losing all your invested capital due to leverage.