USDJPY Technical Analysis | USD under pressure as stable PCE hints at Fed shift
BY Janne Muta
|December 1, 2023USDJPY Technical Analysis - The latest PCE report from the U.S. Commerce Department signals positive trends in inflation and consumer spending. A key highlight is the core Personal Consumption Expenditures (PCE) price index, which is an important measure of inflation, excluding the often volatile prices of gas and food. This index saw a modest rise of 0.2% last month, with a 3.5% increase over the year ending in October.
More notably, when including gas and food prices, the overall PCE index remained unchanged for the first time since July 2022, marking an annual increase of 3% - the lowest since March 2021. This stability in the overall PCE index is a significant indicator of easing inflationary pressures.
Earlier in the week Federal Reserve Governor Christopher Waller expressed support for extending the pause in interest rate hikes into early next year. Governor Bowman, sharing a similar dovish perspective, emphasized the importance of fostering economic growth.
In the light of easing inflation measured by the PCE other Fed officials could be persuaded to turn more dovish with Governors Bowman and Waller.
This potential shift towards a more cautious stance by the Federal Reserve, combined with a strong economy as evidenced by robust Black Friday spending, suggests that the much-anticipated soft landing might be achievable. Consequently, the Fed might be in a position to lower interest rates, as projected by the Fed Funds Futures market. This in turn would signal further weakening of the dollar.
Summary of This USDJPY Technical Analysis Report:
- Our USDJPY technical analysis indicates a bullish market view. The 20-period moving average is trending higher and is positioned above the 50-period SMA. It's also notable that the market bounced higher after testing the dynamic support provided by the 20-period SMA.
- On the daily chart, USDJPY has been moving lower within a descending price channel. If the market breaks above the channel top, we might see a move to the confluence level created by the recent swing high (149.71) and the two moving averages.
- The two-hour chart shows USDJPY creating higher swing lows near the rising 20-period moving average, indicating bullish sentiment. This suggests that the market could attempt to break out of the bearish daily timeframe channel.
Read the full USDJPY Technical Analysis report below.
USDJPY Technical Analysis
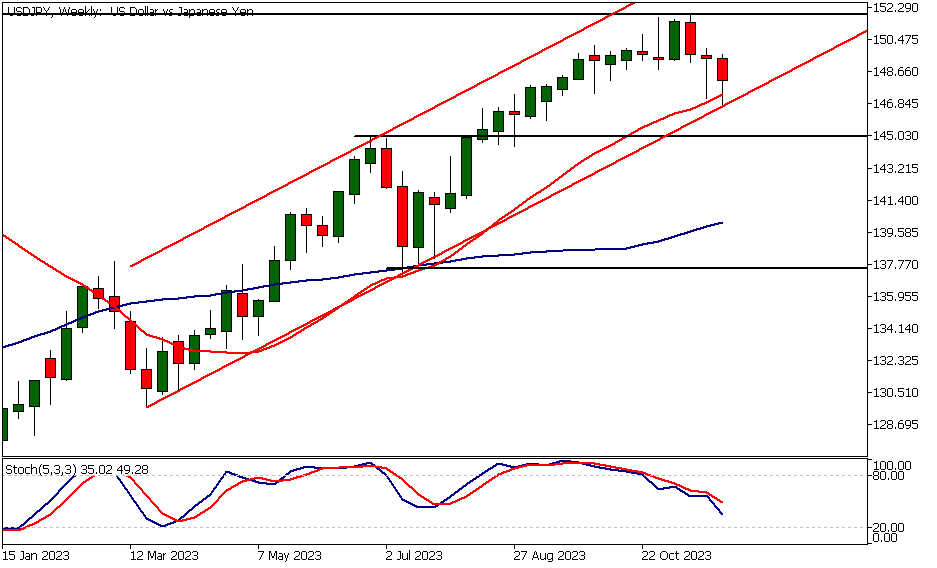
USDJPY Technical Analysis, Weekly Chart
The USDJPY has retraced back to the low of the weekly bullish channel we highlighted in our previous USDJPY technical analysis report. This channel low was closely aligned with the 20-period moving average, likely a factor that attracted short covering and speculative buying in USDJPY on Wednesday and Thursday. The market remains bullish above the ascending trend channel low and could be retesting the 151.90 resistance level soon.
Our USDJPY technical analysis indicates a bullish market view. The 20-period moving average is trending higher and is positioned above the 50-period SMA. It's also notable that the market bounced higher after testing the dynamic support provided by the 20-period SMA.
Alternatively, a break below the bullish channel low could lead the market to trade down to 145.07, while a measured move target based on the channel width points to approximately 139.00.
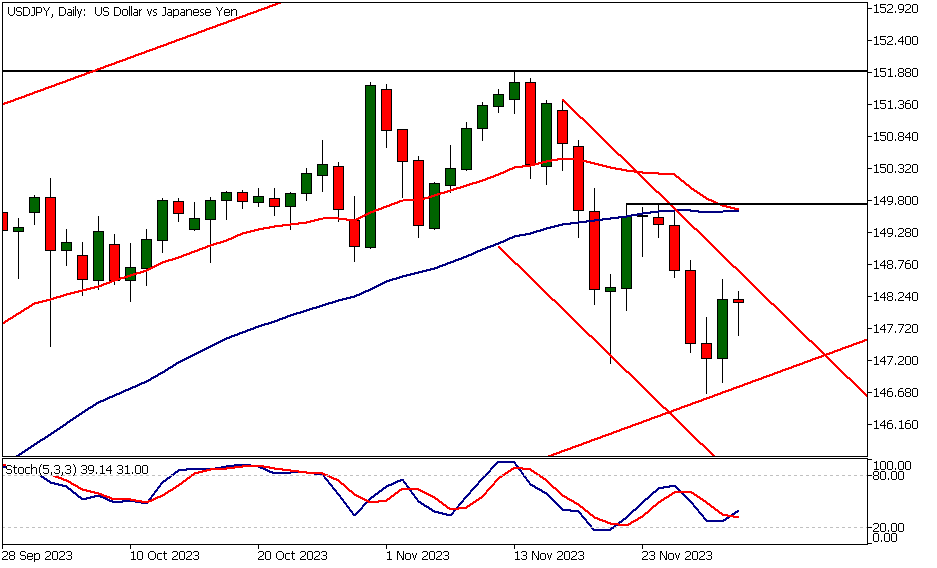
USDJPY Technical Analysis, Daily Chart
On the daily chart, USDJPY has been moving lower within a descending price channel. If the market breaks above the channel top, we might see a move to the confluence level created by the recent swing high (149.71) and the two moving averages.
The 20-period moving average has converged with the 50-period SMA, and if the market doesn't rally, it could cross below the 50-period SMA. This would be a bearish indication according to our indicator-based USD/JPY technical analysis. However, the market is still in an uptrend on the weekly chart and could continue to trade higher.
A more bearish scenario could be constructed by noting that the market is close to a major resistance level at 151.90, and with the Fed expected to cut rates several times in 2024, the market could remain weak and potentially sell off in future rallies.
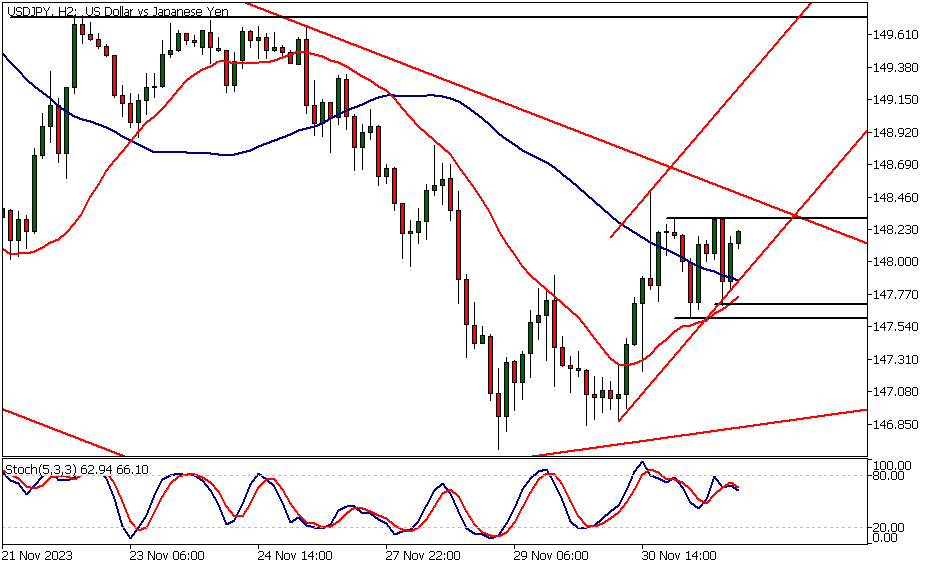
USDJPY Technical Analysis, 2h Chart
The two-hour chart shows USDJPY creating higher swing lows near the rising 20-period moving average, indicating bullish sentiment. This suggests that the market could attempt to break out of the bearish daily timeframe channel.
A decisive rally above the 148.31 resistance level and the daily timeframe bear channel top would open the way to 149.20 and then to 149.70 as an extension. However, our USDJPY technical analysis indicates that a failure to maintain levels above 148.31 would be bearish, potentially driving the market down to 147.
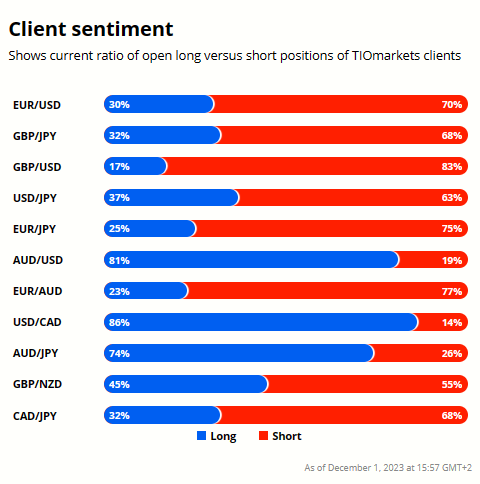
Client sentiment analysis
TIOmarkets clients are slightly bearish on USDJPY with 63% of clients holding short positions and 37% holding long positions in the market.
Please remember that the retail trader client sentiment is a contrarian indicator as most of the retail traders are on average betting against the market trends. This is why, experienced traders tend to trade against the retail client sentiment. You can follow the TIOmarkets client sentiment live on our Forex dashboard.
The next key risk events impacting this market
- USD - ISM Manufacturing PMI
- USD - ISM Manufacturing Prices
- USD - Fed Chair Powell Speaks
- JPY - Tokyo Core CPI
- USD - ISM Services PMI
- USD - JOLTS Job Openings
- USD - ADP Non-Farm Employment Change
- USD - Unemployment Claims
- USD - Average Hourly Earnings
- USD - Non-Farm Employment Change
- USD - Unemployment Rate
- USD - Prelim UoM Consumer Sentiment
- USD - Prelim UoM Inflation Expectations
Potential USDJPY Market Moves
The market remains bullish above the ascending trend channel low and could be retesting the 151.90 resistance level soon.
Alternatively, a break below the bullish channel low could lead the market to trade down to 145.07, while a measured move target based on the channel width points to approximately 139.00.

How would you trade the USDJPY today?
I hope this USDJPY technical analysis helps you to make better informed trading decisions. Check the latest market analysis for other instruments and subscribe to receive them in your inbox as soon as they are published
DISCLAIMER: TIO Markets offers an exclusively execution-only service. The views expressed are for information purposes only. None of the content provided constitutes any form of investment advice. The comments are made available purely for educational and marketing purposes and do NOT constitute advice or investment recommendation (and should not be considered as such) and do not in any way constitute an invitation to acquire any financial instrument or product. TIOmarkets and its affiliates and consultants are not liable for any damages that may be caused by individual comments or statements by TIOmarkets analysis and assumes no liability with respect to the completeness and correctness of the content presented. The investor is solely responsible for the risk of his/her investment decisions. The analyses and comments presented do not include any consideration of your personal investment objectives, financial circumstances, or needs. The content has not been prepared in accordance with any legal requirements for financial analysis and must, therefore, be viewed by the reader as marketing information. TIOmarkets prohibits duplication or publication without explicit approval.

Janne Muta holds an M.Sc in finance and has over 20 years experience in analysing and trading the financial markets.
Related Posts


Trade responsibly: CFDs are complex instruments and come with a high risk of losing all your invested capital due to leverage.