DAX Technical Analysis | CPI fall and Dovish ECB lift German stock market
BY Janne Muta
|December 7, 2023Dax technical analysis - The combination of lower CPI and a gradual economic slowdown, without expectations of a severe downturn, has propelled both US indices and the closely linked DAX to higher levels.
In November, US ADP employment change figures disappointed, signalling slowing job growth, and Q3 Unit Labor Costs saw a -1.2% decrease. This softer labour market data aligns with Fed Funds Futures, which suggests a 60% chance of a March rate cut and four more 25 bp cuts in 2024.
US job openings in November fell by 617K to 8.733 million, the lowest since March 2021 and below the consensus of 9.3 million. However, the ISM Services PMI exceeded expectations, reaching 52.7, reflecting a robust services sector with increased activity and employment. Challenges persist, including concerns about inflation, interest rates, and labour costs.
Despite the ADP report missing expectations, it still indicates a healthy US services sector. In November, private businesses added 103K jobs, below the expected 130K, with most gains in the services sector, adding 117K jobs.
In the Eurozone, October retail sales rose by 0.1%, slightly below the 0.4% forecast, following Germany's surprising 1.1% increase. Germany reported a significant 3.7% decline in October factory orders, disappointing expectations for a small gain. Despite a 20.2% increase in transport equipment orders, a 13.5% drop in machinery and equipment orders reflects weakness in the industrial sector.
The ECB may consider an early rate cut due to lower-than-expected CPI and weak economic data, with even ECB hawk Schnabel suggesting a rate hike is "rather unlikely."
Summary of This Dax Technical Analysis Report:
- The DAX is rallying higher for the sixth consecutive week, reaching new all-time highs above the July peak of 16,531. As long as the price remains above this level, the July high serves as the nearest weekly timeframe support level for the DAX.
- The nearest support daily timeframe levels below July highs are at 15,913, 16,045, and 16,381. The 20-period moving average is trending higher and is positioned above the 50-period SMA, further indicating a bullish market in terms of indicator-oriented DAX technical analysis.
Read the full Dax Technical Analysis report below.
Dax Technical Analysis
Weekly Dax Technical Analysis
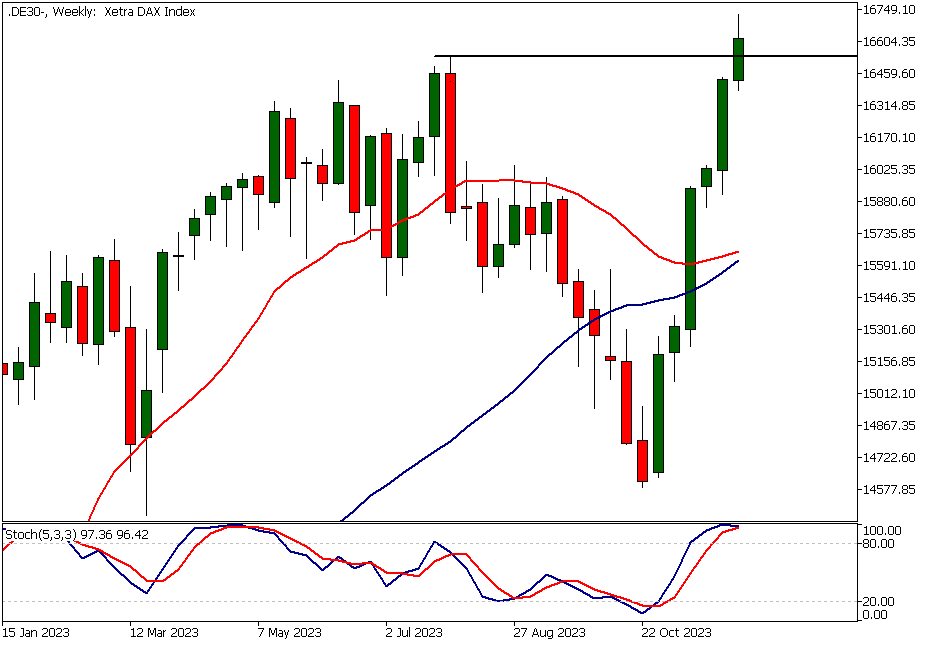
The DAX is rallying higher for the sixth consecutive week, reaching new all-time highs above the July peak of 16,531. As long as the price remains above this level, the July high serves as the nearest weekly timeframe support level for the DAX.
Due to the lack of reference points above the current market price, it's challenging to make reliable estimations about the continuation of the rally. Therefore, traders should focus on price action analysis in smaller timeframe charts to determine if the market continues to honour support levels or if there's sufficient selling pressure to repeatedly push the market below these levels.
If the market fails to attract additional buying above the July high at 16,531 and starts to move below this support level, we might see the market trading down to 16,380. Based on technical analysis, the market is in an uptrend, with both moving averages pointing higher and the 20-period moving average above the 50-period SMA.
Daily Dax Technical Analysis
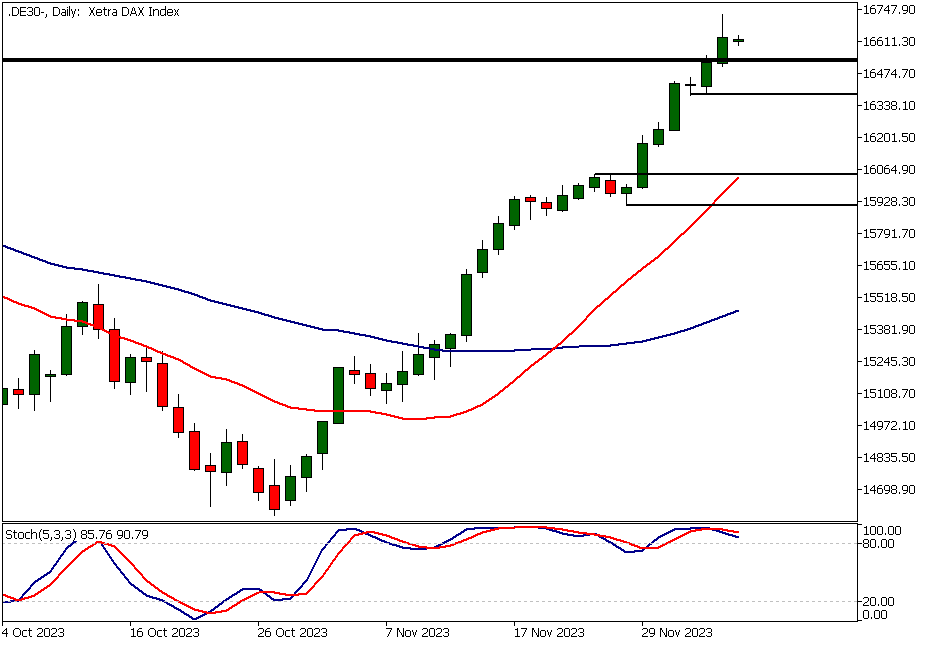
The daily chart reveals a strong uptrend with only a few down days, indicating that the market has not created many potential support levels on the way up.
The nearest support levels are at 15,913, 16,045, and 16,381. The 20-period moving average is trending higher and is positioned above the 50-period SMA, further indicating a bullish market in terms of indicator-oriented DAX technical analysis.
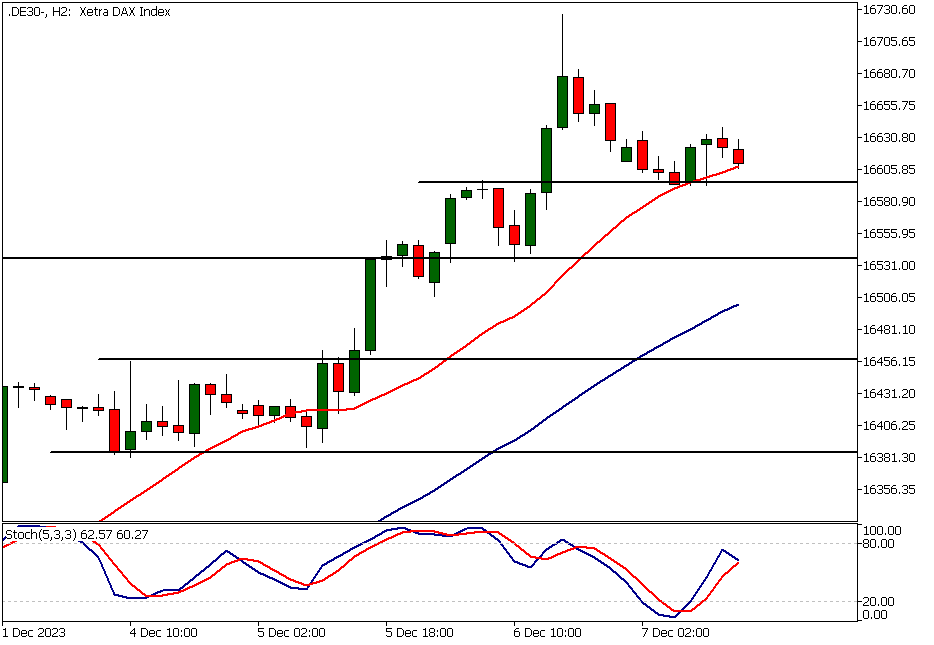
Dax Technical Analysis, 2h
The two-hour chart also exhibits bullish tendencies, showing the market in an uptrend. The nearest key support level is at 16,597, which has bounced the DAX higher today. Note how this level closely aligns with the 20-period SMA, adding to its significance. Below the July peak, the next support levels can be found at 16,380 and 16,455.
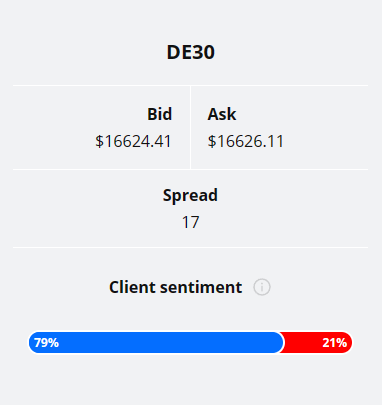
Client sentiment analysis
TIOmarkets' clientele are bullish on Dax, with 79% of clients holding long positions and only 21% short the market.
Please remember that the retail trader client sentiment is a contrarian indicator as most of the retail traders are on average betting against the market trends. This is why, experienced traders tend to trade against the retail client sentiment. You can follow the TIOmarkets client sentiment live on our Forex dashboard.
The next key risk events impacting this market
- USD - Average Hourly Earnings
- USD - Non-Farm Employment Change
- USD - Unemployment Rate
- USD - Prelim UoM Consumer Sentiment
- USD - Prelim UoM Inflation Expectations

Potential Dax Market Moves
The DAX is rallying higher for the sixth consecutive week, reaching new all-time highs above the July peak of 16,531. As long as the price remains above this level, the July high serves as the nearest weekly timeframe support level for the DAX.
If the market fails to attract additional buying above the July high at 16,531 and starts to move below this support level, we might see the market trading down to 16,380.
How would you trade the Dax today?
I hope this fundamental and technical Dax analysis helps you to make better informed trading decisions. Check the latest market analysis for other instruments and subscribe to receive them in your inbox as soon as they are published
DISCLAIMER: TIO Markets offers an exclusively execution-only service. The views expressed are for information purposes only. None of the content provided constitutes any form of investment advice. The comments are made available purely for educational and marketing purposes and do NOT constitute advice or investment recommendation (and should not be considered as such) and do not in any way constitute an invitation to acquire any financial instrument or product. TIOmarkets and its affiliates and consultants are not liable for any damages that may be caused by individual comments or statements by TIOmarkets analysis and assumes no liability with respect to the completeness and correctness of the content presented. The investor is solely responsible for the risk of his/her investment decisions. The analyses and comments presented do not include any consideration of your personal investment objectives, financial circumstances, or needs. The content has not been prepared in accordance with any legal requirements for financial analysis and must, therefore, be viewed by the reader as marketing information. TIOmarkets prohibits duplication or publication without explicit approval.

Janne Muta holds an M.Sc in finance and has over 20 years experience in analysing and trading the financial markets.
Related Posts


Trade responsibly: CFDs are complex instruments and come with a high risk of losing all your invested capital due to leverage.