S&P 500 Forecast for the Week of 9th March 2026
BY TIOmarkets
|March 9, 2026S&P 500 Market Overview
The S&P 500 enters the week of 9–13 March 2026 under notable pressure after a volatile period driven by geopolitical and macroeconomic developments. The index finished last week around 6,663, declining roughly 2%, as investors reacted to rising energy prices and unexpectedly weak U.S. labor market data.
A key catalyst for the recent risk-off move has been the escalation of geopolitical tensions in the Middle East. Disruptions linked to the Iran–Israel conflict have pushed oil prices above $100 per barrel, with concerns surrounding the Strait of Hormuz threatening a significant portion of global supply. The sharp surge in crude prices has raised inflation concerns across global markets.
At the same time, macroeconomic data from the United States introduced new uncertainty. The February employment report showed a decline of approximately 92,000 jobs, significantly weaker than expectations. The combination of rising energy costs and slowing labor market momentum has fueled discussion around a potential stagflationary environment, which tends to weigh on equity valuations.
Sector rotation reflects this shift in sentiment. Energy and defense stocks have outperformed, benefiting from higher commodity prices and geopolitical uncertainty. Meanwhile, airlines, industrials, cyclical sectors, and some AI-related hardware companies have underperformed, highlighting investor caution toward sectors sensitive to economic growth and input costs.
Despite the recent decline, the broader structural uptrend in the S&P 500 remains intact for now. The index is still trading above its 200-day moving average, suggesting that the current move may represent a correction within a longer-term bullish cycle rather than a confirmed trend reversal.
Technical Analysis for S&P 500
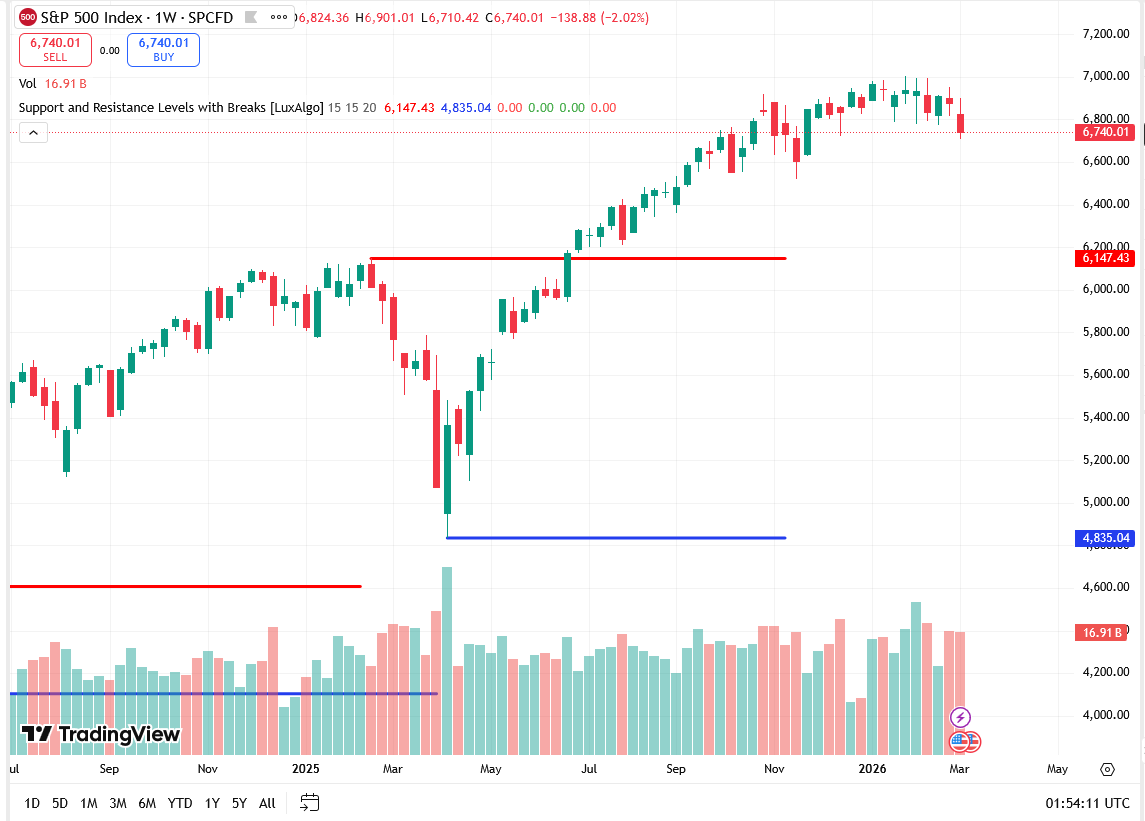
From a technical perspective, the short-term trend for the S&P 500 is currently bearish, as the index trades below most short- and medium-term moving averages. This positioning indicates that downward momentum has strengthened during the recent selloff.
Momentum indicators reinforce this view. The MACD remains negative, while broader momentum indicators continue to signal weakening price action. Additionally, the Average Directional Index (ADX) above 35 suggests that the current directional move is relatively strong, meaning that market sentiment has shifted decisively in the near term.
However, several indicators also suggest that the market may be approaching a short-term exhaustion phase. The Commodity Channel Index near −290 and Williams %R around −90 indicate extremely oversold conditions. Historically, such readings often appear during periods of capitulation or near temporary market bottoms.
The index is currently trading below the weekly pivot near 6,900, which confirms that bearish momentum remains dominant. Being several percent below this pivot level highlights the extent of the recent correction and the cautious tone among institutional investors.
Key Support Levels
Important technical support zones to watch include:
- 6,650 – 6,600 – Immediate support zone near the current market price
- 6,600 – Major psychological support level
- 6,350 – Lower structural support area if selling pressure accelerates
A notable technical factor is that the 200-day moving average is positioned near the 6,600 area, creating a strong confluence of support that may attract defensive positioning from longer-term investors.
Key Resistance Levels
On the upside, resistance levels include:
- 6,900 – Key pivot level and first major resistance
- 7,000 – Psychological resistance area
- 7,050 – Higher resistance if bullish momentum strengthens
For the market to regain stronger upward momentum, the index would likely need to reclaim the 6,900–7,000 region, which previously acted as a key support area before the recent decline.
Overall, the technical structure suggests a short-term corrective downtrend occurring within a broader long-term uptrend.
Bullish Scenario
A constructive scenario for the S&P 500 could develop if the index successfully stabilizes near the 6,600 support region, which currently coincides with the long-term moving average and a psychological price level. Holding this support zone could encourage short covering and opportunistic positioning from institutional investors, particularly given the extremely oversold momentum indicators. In such a case, the market could attempt a rebound toward the 6,900 pivot level, which represents the first major resistance area.
If bullish momentum strengthens further, the next potential upside targets could be located near 7,000 and 7,050. A move toward these levels would likely require improving risk sentiment, stabilization in energy markets, or macroeconomic data that alleviates stagflation concerns.
Such a rebound would likely be interpreted as a technical recovery within the broader long-term trend, rather than the beginning of a new strong bullish leg.
Bearish Scenario
A more negative scenario could unfold if the S&P 500 fails to hold the 6,600 support level. A decisive daily close below this area could signal that selling pressure remains dominant and that institutional risk reduction continues. In this situation, systematic strategies and momentum-based funds could increase short exposure, potentially accelerating downside volatility. The next technical objective in such a scenario would likely be the 6,350 support region, which represents a lower structural level within the current correction.
Additional downside pressure could emerge if rising oil prices continue to push inflation expectations higher or if economic data signals further deterioration in growth momentum. Under such conditions, equity markets may struggle as investors reassess corporate earnings expectations and valuation multiples.
Overall, a sustained move below 6,600 would likely shift market sentiment more decisively toward a defensive stance.
S&P 500 Fundamental Drivers
Several macroeconomic forces are currently shaping the outlook for the S&P 500.
Monetary Policy Expectations
Federal Reserve policy remains the dominant macro driver for equity valuations. The Fed funds rate currently sits around 4.50–4.75%, and markets are still pricing the possibility of two to three rate cuts during 2026.
Real interest rates remain relatively restrictive, however, which continues to place pressure on equity valuations. Historically, shifts in real yields have had a significant impact on price-to-earnings multiples across the index.
Corporate Earnings Growth
Corporate earnings expectations remain an important pillar supporting the longer-term equity outlook. Consensus forecasts suggest S&P 500 earnings per share could grow from roughly $278 in 2025 to around $320 in 2026, representing approximately 15% annual growth.
A significant portion of this expansion is expected to come from the technology sector, particularly through investments in artificial intelligence infrastructure and digital services.
It is also notable that the largest companies in the index contribute roughly one-third of total earnings growth, meaning performance in mega-cap technology firms continues to have an outsized impact on the overall index.
Energy Prices and Inflation
Oil prices have become a critical macro variable in the current environment. The recent surge above $100 per barrel has raised concerns about a renewed inflation shock.
Higher energy costs can impact corporate margins through increased transportation, production, and logistics expenses. Historically, each $10 increase in oil prices can reduce aggregate S&P 500 earnings by approximately 1–1.5%, highlighting the potential impact of sustained energy volatility.
Liquidity Conditions
Global liquidity trends also influence equity market performance. Currently, liquidity conditions remain moderate rather than expansionary, as central banks maintain relatively tight monetary policy and government debt issuance remains elevated.
This environment tends to limit rapid upside moves in equity markets, even when earnings growth remains strong.
Corporate Buybacks
Share buybacks continue to provide structural support for U.S. equities. Corporate repurchases are expected to remain substantial in 2026, with estimates ranging between $900 billion and $1.1 trillion.
Buybacks can act as a stabilizing force during market corrections by providing consistent demand for equities.
This Week's S&P 500 High Impact Events
Several economic releases could influence market volatility during the week.
- NFIB Small Business Optimism Index (Tuesday)
This report provides insight into economic sentiment among small businesses and can serve as an early indicator of broader economic momentum. - US CPI Inflation Report (Wednesday)
One of the most closely watched data releases for equity markets. Higher-than-expected inflation could lead investors to reassess expectations for Federal Reserve rate cuts. - Initial Jobless Claims (Thursday)
Weekly labor market data that helps investors monitor employment trends and potential shifts in economic growth. - University of Michigan Consumer Sentiment (Friday)
A key measure of consumer confidence and inflation expectations, which are closely tied to consumer spending trends in the U.S. economy.
Risk Considerations for S&P 500 This Week
Several risk factors could influence market performance in the coming days.
Inflation Surprise Risk
If the upcoming CPI report exceeds expectations, markets may begin pricing a slower pace of monetary easing. Rising bond yields could lead to valuation compression in growth sectors, particularly technology stocks.
Energy Market Volatility
Geopolitical tensions affecting global oil supply remain a major uncertainty. Sustained increases in energy prices could amplify inflation pressures and weigh on corporate margins.
Technical Fragility Near Support
The index is currently trading near a major technical support zone around 6,600. A breakdown below this level could trigger algorithmic selling and increase volatility.
Market Concentration
Large technology companies continue to dominate index performance. Because the largest seven companies represent a significant share of the S&P 500, sharp movements in mega-cap stocks can heavily influence overall market direction.

Risk disclaimer: CFDs are complex instruments and come with a high risk of losing money rapidly due to leverage. You should consider whether you understand how CFDs work and whether you can afford to take the high risk of losing your money. Never deposit more than you are prepared to lose. Professional client’s losses can exceed their deposit. Please see our risk warning policy and seek independent professional advice if you do not fully understand. This information is not directed or intended for distribution to or use by residents of certain countries/jurisdictions including, but not limited to, USA & Countries included in the OFAC sanction list. The Company holds the right to alter the aforementioned list of countries at its own discretion.
TIOmarkets offers an exclusively execution-only service. The views expressed are for information purposes only. None of the content provided constitutes any form of investment advice. The comments are made available purely for educational and marketing purposes and do NOT constitute advice or investment recommendation (and should not be considered as such) and do not in any way constitute an invitation to acquire any financial instrument or product. TIOmarkets and its affiliates and consultants are not liable for any damages that may be caused by individual comments or statements by TIOmarkets analysis and assumes no liability with respect to the completeness and correctness of the content presented. The investor is solely responsible for the risk of his/her investment decisions. The analyses and comments presented do not include any consideration of your personal investment objectives, financial circumstances, or needs. The content has not been prepared in accordance with any legal requirements for financial analysis and must, therefore, be viewed by the reader as marketing information. TIOmarkets prohibits duplication or publication without explicit approval.
Join us on social media

Behind every blog post lies the combined experience of the people working at TIOmarkets. We are a team of dedicated industry professionals and financial markets enthusiasts committed to providing you with trading education and financial markets commentary. Our goal is to help empower you with the knowledge you need to trade in the markets effectively.
Related Posts