Forex Fakeout Trading & How To Trade Breakouts
BY TIO Staff
|December 28, 2022Forex fakeout trading, False Breakout, Failed Breakout, it’s all the same thing. But does it need to be a frustrating or devastating event?
Not really.
To know how to deal with fakeouts in forex, you first need to know what they are. You need to know why they happen and how to avoid them when trading. You also need to know how to potentially take advantage of fakeouts for your benefit.
In this article we explain and reveal forex fakeout trading strategies and how to trade breakouts or the failure of them. We answer some FAQs about how to trade a breakout; and show you how to take advantage of these opportunities.
If you want to master fakeouts and breakouts in forex trading, you’ve come to the right place.
So without any further delay, let's get started.
What is a Fakeout in Forex trading?
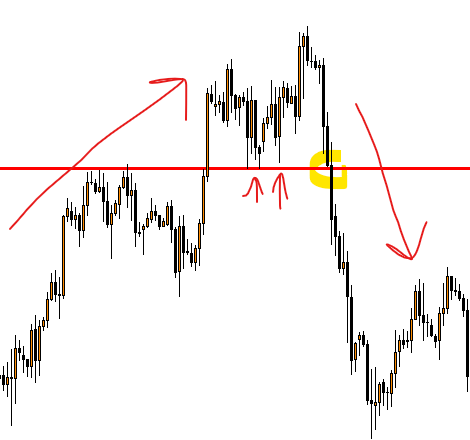
A forex fakeout is when a trader opens a position after price breaks a support or resistance area, expecting price to make new highs or lows. But the movement never materializes and the price quickly reverses in the opposite direction. In technical analysis, this event is referred to as a fakeout, or a false or failed breakout.
Why do Forex Fakeouts Happen?
Fakeouts happen when the price crosses or breaks through a particular level (support, resistance, triangle, trend lines, etc.) but fails to continue moving in that direction after the breakout. Usually because there is overwhelming supply or demand or a lack of supply or demand to maintain price momentum. The price retreats back instead looking for supply or demand elsewhere.
What Is a Support Level
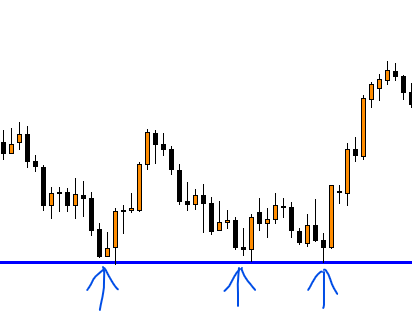
A support level is an area where price was supported from falling lower. It’s set by connecting the recent lows in price that occur when the price is going down. This shows an area where it may be safe to buy. This area shows where prices have rebounded in the past. These are important to watch because they can help you determine whether or not an asset is likely to continue its current trend or reverse course.
For example, if you want to buy more shares of Apple and you’ve noticed it’s been trending down for a while, you can use historical support areas to determine where price might bounce and reverse to trade higher.
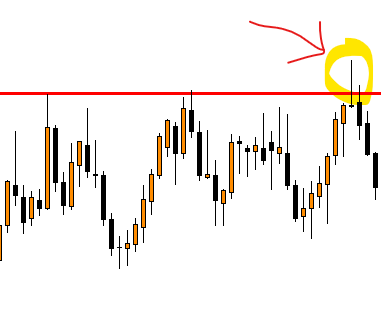
What Is a Resistance Level
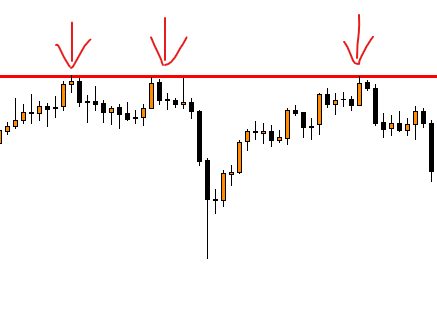
Resistance refers to a specific price level or area on a chart at which an upward price trend of a currency pair may encounter obstacles or resistance due to the accumulation of supply (sell orders) at or around that price level. This means that at a resistance level, the upward movement of an asset may face restrictions as the pool of potential sellers who wish to sell that asset at a said price increases.
Is there a difference between a Forex Fakeout and a Breakout?
It’s hard to determine whether there is a difference between a breakout and a fakeout until after the event.
A breakout is what happens right before a potential fakeout (false breakout). A breakout is basically a potentially advantageous trading opportunity which happens when price breaks over a resistance level or goes below a support level. As traders anticipate a resumption of the trend and higher prices.
A fakeout, also known as a false breakout, happens after a breakout. When prices go beyond a support or resistance level, that’s the breakout. If price suddenly reverses and goes that’s a fakeout (false breakout).
In layman’s terms, a fakeout is like ‘fake hope’. You’re hoping that the asset will continue to rise or fall when it breaks out of support or resistance. So you enter the market (or not) and then shortly afterwards the price starts moving in the opposite direction. Trapping you in the market going the wrong way.
How To Take Advantage of a Breakout
Breakouts don’t always lead to a fakeout, at least not right away. A breakout could continue to rise by a fair amount after breaking through a support or resistance level. In such cases it’s often followed by a period of consolidation or a retest of the previous support or resistance area.
There are two main types of breakouts: continuation breakouts and reversal breakouts.
Continuation breakouts
A continuation breakout is a bullish or bearish price pattern that occurs when the price of an asset breaks out above support or resistance level to continue the existing trend.
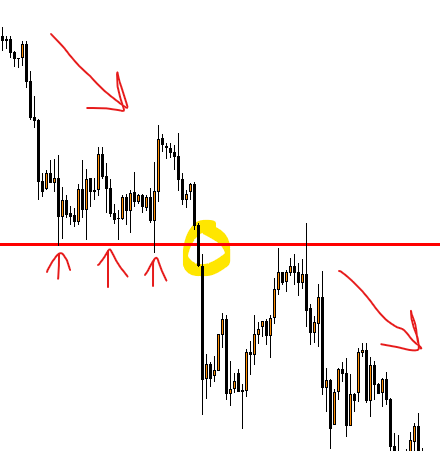
Reversal Breakouts
A reversal breakout occurs when support or resistance fails in a bullish or bearish price trend. When price breaks out, it can signal a reversal of the established price trend.
What To Do During a Breakout
Depending on whether the breakout is a continuation or reversal breakout there are a few steps you can take.
Trading breakouts can be tricky. As soon as you think you’ve got your a good support or resistance level, the market throws you a curveball and the breakout fails.
When trading, there are times when it’s best to hold back and let the market give you ample signals to take any course of action.
Here are some tips:
- Take a look at what’s happening in the market overall.
- Look at other indicators for additional confirmation.
- Wait for price to pivot at support and resistance with a retest.
How Do You Avoid Forex Fakeouts When Trading?
To avoid fakeouts in trading you must pay extra attention around the support or resistance level. And set realistic stop losses to cut your trade or be prepared to reverse.
How to Detect an trade a Forex Fakeout
Detecting a fakeout in trading takes practice and strategic analysis. Here are a few strategies that might help you to identify a fakeout:
- Wait for the close of a candlestick. This means you'll want to see if the price bar or candlestick closes through the support or resistance level. Just seeing the wick poking through isn't enough to confirm a breakout.
- Use other technical indicators. If you see a price break through an important support or resistance level and other indicator suggest its likely to follow through.
- Understand the market psychology. Fakeouts often occur when trader optimism or pessimism is at its peak. Keep an eye on market sentiment and anticipate trader behaviour. If you notice client positioning is at an extreme, be cautious of a potential fakeout.
- Volume observation. During a real breakout, you'd generally expect to see a considerable increase in volume. A sudden surge in volume might be indicative of a legitimate breakout, whereas a lack of volume can often signal a fakeout.
However, it's important to remember that these techniques are not failproof and you should use them as part of a comprehensive trading strategy.
Forex Fakeouts Finale
In conclusion, fakeouts are nothing to be scared of once you are aware of them. Being equipped with this knowledge may help you to see a fakeout coming.
If you wold like to learn more about trading, sign up to our forex video training course. Its free!
Then when you are ready, open an account to practice.
Risk disclaimer: CFDs are complex instruments and come with a high risk of losing money rapidly due to leverage. You should consider whether you understand how CFDs work and whether you can afford to take the high risk of losing your money. Never deposit more than you are prepared to lose. Professional client’s losses can exceed their deposit. Please see our risk warning policy and seek independent professional advice if you do not fully understand. This information is not directed or intended for distribution to or use by residents of certain countries/jurisdictions including, but not limited to, USA & OFAC. The Company holds the right to alter the aforementioned list of countries at its own discretion.
Join us on social media

Behind every blog post lies the combined experience of the people working at TIOmarkets. We are a team of dedicated industry professionals and financial markets enthusiasts committed to providing you with trading education and financial markets commentary. Our goal is to help empower you with the knowledge you need to trade in the markets effectively.
Related Posts


undefined