Golden Cross: Explained
BY TIOmarkets
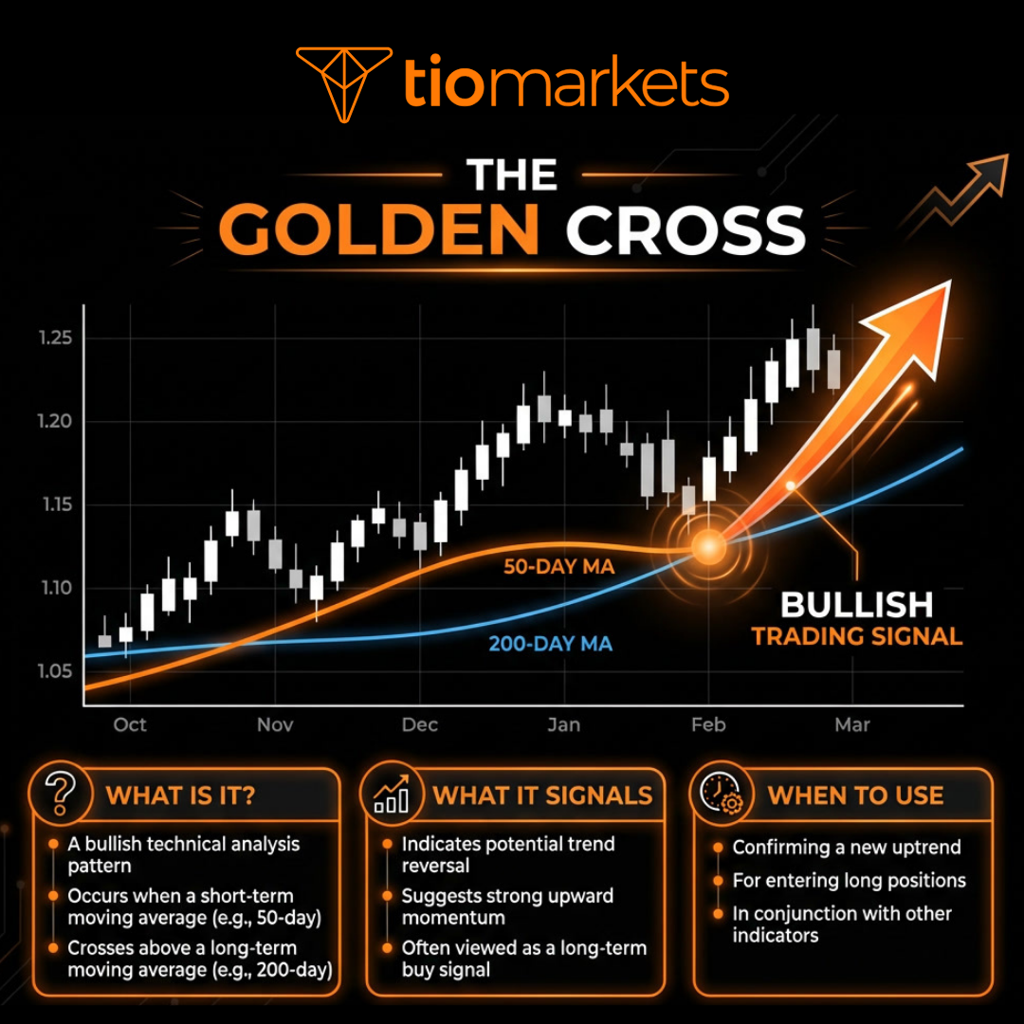
|February 27, 2026The golden cross in trading is a technical analysis pattern that traders use to identify potential bullish momentum in the financial markets. It occurs when a shorter-term moving average crosses above a longer-term moving average. Specifically, when the 50-day moving average crosses above the 200-day moving average. This crossover is considered a bullish signal, suggesting that upward price movement may be on the horizon.
What is the golden cross in trading?
A golden cross is a chart pattern where the 50-day moving average crosses above the 200-day moving average, signaling a potential shift from bearish to bullish market sentiment. Traders across multiple markets, including stocks, forex, commodities, and cryptocurrencies, monitor this technical pattern as an opportunity to enter long positions or confirm existing bullish trends.
The golden cross is popular because it's straightforward to identify and can signal significant trend changes. However, like all technical indicators, it has limitations and should be used alongside other analysis tools and risk management strategies.
Here's what defines a golden cross:
- Two moving averages with different timeframes
- The shorter-term average crosses above the longer-term average
- Most commonly uses 50-day and 200-day moving averages
- Signals potential bullish momentum
- Considered the opposite of a death cross (bearish signal)
How does golden cross trading work?
The golden cross works by comparing average prices over two different time periods. Moving averages smooth out daily price fluctuations by calculating the average closing price over a set number of days. This makes it easier to see the overall direction of the trend.
When the 50-day moving average (which reflects more recent price action) crosses above the 200-day moving average (which reflects longer-term trends), it indicates that recent buying activity has become strong enough to potentially reverse the previous downtrend.
The three stages of a golden cross
A golden cross doesn't happen all at once. The pattern typically develops in three distinct stages, each with its own characteristics. Understanding these stages can help you identify where the market is in the pattern formation and make more informed trading decisions.
Stage 1: The downtrend
Before a golden cross can form, the market needs to be in a downtrend. During this stage, the 50-day moving average sits below the 200-day moving average, confirming bearish momentum.
What happens during Stage 1:
- Prices are declining or making lower lows
- Selling pressure dominates the market
- The 50-day MA remains below the 200-day MA
- Bearish sentiment is established
This stage sets up the conditions for a potential reversal. The longer the downtrend lasts, the more significant the eventual golden cross may be when it occurs.
Stage 2: The crossover
This is the moment when the golden cross actually forms. The 50-day moving average rises and crosses above the 200-day moving average. This is the signal that most traders watch for.
What happens during Stage 2:
- The 50-day MA crosses above the 200-day MA
- Trading volume often increases
- Market volatility may pick up
- Traders begin to recognize the pattern
The crossover itself is the key event, but many traders wait for additional confirmation before entering positions. This might include waiting for the 50-day average to remain above the 200-day average for several days, or looking for increased volume to validate the signal.
Stage 3: The uptrend confirmation
After the crossover occurs, both moving averages begin trending upward, with the 50-day remaining above the 200-day. This stage confirms that the new bullish trend is taking hold.
What happens during Stage 3:
- Both moving averages slope upward
- The 50-day MA stays above the 200-day MA
- The gap between the two averages widens
- Prices continue to rise as bullish momentum builds
This stage can last for extended periods during strong bull markets. The longer the 50-day average remains above the 200-day average, the stronger the bullish trend is considered to be.
Understanding these three stages helps you identify not just when a golden cross occurs, but also where the market is in the overall pattern. Each stage presents different opportunities and risks, which is why it's important to consider the full context when using this strategy.
Golden cross vs death cross
The golden cross and death cross are opposite patterns that signal contrasting market conditions. While the golden cross is bullish, the death cross is bearish. Understanding both patterns helps you recognize major trend changes in either direction.
Golden Cross
- 50-day MA crosses above 200-day MA
- Signals potential bullish trend
- Suggests buyers are gaining control
- Often appears after market bottoms
- Associated with the start of uptrends
Death Cross
- 50-day MA crosses below 200-day MA
- Signals potential bearish trend
- Suggests sellers are gaining control
- Often appears after market tops
- Associated with the start of downtrends
The main difference between these patterns is direction. A golden cross suggests upward momentum, while a death cross warns of downward pressure. Both use the same moving averages (50-day and 200-day), making them mirror images of each other.
Why traders use the golden cross
The golden cross has become a popular tool in technical analysis for several reasons. Here's why traders pay attention to this pattern:
Easy to identify
The pattern is straightforward to spot on charts. You don't need complex calculations or subjective interpretation. When the 50-day moving average crosses above the 200-day moving average, the signal is clear and visible to all market participants.
Historical track record
Golden crosses have appeared before many significant market rallies throughout history. While no indicator is perfect, the pattern's track record gives it credibility among technical traders. This historical reliability makes it worth monitoring as part of a broader trading strategy.
Signals potential trend changes
Rather than trying to predict exact market bottoms, the golden cross waits for momentum to shift before signaling. This approach helps traders avoid entering positions too early during downtrends. By the time a golden cross forms, there's already evidence that the trend may be changing.
Widely recognized
Because many traders watch for golden crosses, the pattern can become self-fulfilling. When enough market participants recognize the signal and act on it, their collective buying activity can help push prices higher, which validates the signal and attracts even more buyers.
Provides clear reference points
The pattern gives traders clear levels for risk management. Many traders place stop-loss orders below the 200-day moving average or below recent swing lows. This makes it easier to define risk and manage positions systematically.
Markets where the golden cross applies
The golden cross pattern can be applied across multiple financial markets. However, its effectiveness may vary depending on the specific characteristics of each market. These markets include but is not limited to;
- Forex
- Stocks
- Indices
- Commodities
- Cryptocurrencies
How to start golden cross trading
Identifying a golden cross requires a systematic approach. Here's how to spot this pattern on your charts, step by step.
Step 1: Add moving averages to your chart
Open your trading platform and add two simple moving averages to your price chart:
- 50-day moving average
- 200-day moving average
Use different colors for each moving average so you can easily distinguish between them. Most trading platforms, including MT4 and MT5, allow you to customize the appearance of your indicators.
Step 2: Check the current relationship
View symbols and look at where the two moving averages currently sit in relation to each other:
- If the 50-day is below the 200-day: A potential golden cross setup may be developing
- If the 50-day is above the 200-day: A golden cross may have already occurred
- Note how far apart the averages are
The distance between the two moving averages can tell you how strong the current trend is. A wide gap suggests a strong trend, while converging lines suggest the trend may be weakening.
Step 3: Watch for convergence
Monitor your chart as the 50-day average approaches the 200-day average:
- The two lines should be getting closer together
- Price action should be showing signs of strength
- Volume may increase, divergence between price and technical indicators may be evident, candlestick or chart patterns may be forming
Convergence is a key signal that a golden cross may be forming. As the lines get closer, pay attention to price action and volume for additional confirmation.
Step 4: Confirm the crossover
The actual golden cross occurs when:
- The 50-day moving average crosses completely above the 200-day
- The 50-day line is clearly visible above the 200-day line
- The crossover is definitive and on the close of the candle, not just a brief touch.
Some traders wait for the crossover to be confirmed by several days of the 50-day remaining above the 200-day. This helps filter out false signals where the averages cross briefly before reversing.
Step 5: Verify the trend
After the crossover, look for confirmation that the new trend is taking hold:
- Both moving averages should begin sloping upward
- Price should be trading above both moving averages
- There should be some sustained separation between the averages
This verification step helps ensure you're seeing a genuine trend change rather than a temporary fluctuation. The stronger these confirmation signals, the more reliable the golden cross is likely to be.
Remember that identifying a golden cross is just the first step in the trading process. You still need to consider entry timing, position sizing, stop-loss placement, and other risk management factors before entering a trade.
Always use the golden cross as part of a broader trading strategy that includes proper risk management and additional confirmation from other technical or fundamental analysis tools.
Trading the golden cross strategy
The golden cross trading strategy is a straightforward and widely recognized technical analysis tool that helps traders identify potential bullish trend changes in the financial markets. It occurs when the 50-day moving average crosses above the 200-day moving average, creating a clear signal of building upward momentum.
We've covered the mechanics of the golden cross, from its three-stage formation - the downtrend, the crossover, and the uptrend confirmation - to its relationship with its bearish counterpart, the death cross. The pattern is valued for its ease of identification, historical track record before major rallies, and its applicability across various markets, including forex, stocks, commodities, and cryptocurrencies.
The key to successfully using the golden cross is to employ it not as a standalone system, but as part of a comprehensive trading approach. This includes:
- Properly confirming the pattern after the crossover.
- Combining it with other technical indicators and volume analysis.
- Implementing sound risk management practices (such as stop-loss orders).
- Maintaining realistic expectations and understanding its limitations as a lagging indicator that can produce false signals in volatile or sideways markets.
By combining the clear signals of the golden cross with prudent trading practices, discipline, and continuous learning, traders can work toward developing a sustainable and balanced approach to market participation.
Once you're comfortable with the strategy and have developed your risk management rules, you can transition to live trading with appropriate position sizes. Remember to start small, keep learning, and always prioritize capital preservation. The golden cross is one tool in your trading toolkit. Use it wisely as part of a balanced approach to the markets.
FAQ
How reliable is the golden cross as a trading signal?
While the golden cross has historically preceded many significant market rallies, it's not infallible. The pattern produces both winning and losing trades. Success depends on proper risk management, current market conditions, and combining it with other analysis tools. (Trading is risky) No technical indicator guarantees profits, and past performance doesn't ensure future results.
Can I use different moving average periods besides 50 and 200 days?
Yes, you can adjust the periods based on your trading style. Shorter periods like 20/50 create more frequent signals for active traders, while longer periods like 100/200 generate fewer but potentially stronger signals. However, the 50/200 combination remains the most widely recognized standard, which means it may have more impact on market psychology.
Is golden cross trading a suitable strategy for beginners?
The golden cross can be suitable for beginners due to its simplicity and clear signals. However, beginners should test the strategy first, start with small positions, use proper risk management, and practice in demo accounts. Understanding that losses are possible is important before trading with real money.
What's the difference between a golden cross on different chart timeframes?
Golden crosses on the higher timeframe charts are less frequent but potentially more significant, indicating longer-term trend changes. Golden crosses on the lower timeframe charts are more frequent but are not as significant. A golden cross on the daily, weekly or monthly charts provides stronger confirmation.

Risk disclaimer: CFDs are complex instruments and come with a high risk of losing money rapidly due to leverage. You should consider whether you understand how CFDs work and whether you can afford to take the high risk of losing your money. Never deposit more than you are prepared to lose. Professional client’s losses can exceed their deposit. Please see our risk warning policy and seek independent professional advice if you do not fully understand. This information is not directed or intended for distribution to or use by residents of certain countries/jurisdictions including, but not limited to, USA & Countries included in the OFAC sanction list. The Company holds the right to alter the aforementioned list of countries at its own discretion.
TIOmarkets offers an exclusively execution-only service. The views expressed are for information purposes only. None of the content provided constitutes any form of investment advice. The comments are made available purely for educational and marketing purposes and do NOT constitute advice or investment recommendation (and should not be considered as such) and do not in any way constitute an invitation to acquire any financial instrument or product. TIOmarkets and its affiliates and consultants are not liable for any damages that may be caused by individual comments or statements by TIOmarkets analysis and assumes no liability with respect to the completeness and correctness of the content presented. The investor is solely responsible for the risk of his/her investment decisions. The analyses and comments presented do not include any consideration of your personal investment objectives, financial circumstances, or needs. The content has not been prepared in accordance with any legal requirements for financial analysis and must, therefore, be viewed by the reader as marketing information. TIOmarkets prohibits duplication or publication without explicit approval.
Join us on social media

Behind every blog post lies the combined experience of the people working at TIOmarkets. We are a team of dedicated industry professionals and financial markets enthusiasts committed to providing you with trading education and financial markets commentary. Our goal is to help empower you with the knowledge you need to trade in the markets effectively.
Related Posts