Oil Technical Analysis | Strong Breakout From The Base
BY Janne Muta
|January 30, 2024Oil Technical Analysis - The oil market rallied strongly last week due to a combination of geopolitical tensions and economic factors. A significant increase in oil prices followed a report of faster-than-expected growth in the US economy in the last quarter.
We have been focusing on the oil market building a base as hedge funds have been cautiously buying oil and now the market has broken out of this base.
In Q4 2023, the US economy outperformed expectations with a 3.3% annualized growth, better than the predicted 2% and following a 4.9% rise in Q3. Consumer spending slowed to 2.8%, with goods growth at 3.8%. Service consumption, however, increased to 2.4%, led by food services, accommodations, and healthcare.
Additionally, the escalation of geopolitical tensions in the Middle East, particularly disruptions in the Red Sea, has contributed to concerns over supply. This situation has been exacerbated by attacks on shipping routes and oil facilities, leading to a heightened sense of uncertainty in the market.
Yesterday the market reacted lower due to concerns over demand in China, particularly due to the deepening crisis in its property sector. This situation has impacted investor confidence in China, the world's top oil importer. The liquidation of the China Evergrande Group has led to a reassessment of the oil market, with a shift in focus from supply disruptions to demand concerns.
Summary of This Oil Technical Analysis Report:
- Last week's candle is a bullish wide-range candle that suggests we could see further strength in the oil market. The market might retrace lower first though as the Evergrande liquidation has worried the markets. This increases risk of the market drifting lower to the 74.57 - 75.28 range. Should the market trade down to this range we will be monitoring the market for signs of institutional buying coming back into the market.
- If the 76.18 level doesn't hold the oil technical analysis indicates the market could test the next key support level at 75.28. If there is renewed buying interest in the market at the 75.28 level, look for a push higher to the 79.58 - 80.62 range. Alternatively, USOIL might drop down to 73.60 or so.
- Our oil technical analysis suggests that if there's a decisive rally above the SMA 50, the oil bulls could be targeting the 78.23 intraday while swing traders might target the 79.58 - 80.62 range. Alternatively, a failure to penetrate the SMA 50 could lead to the market breaking the nearest key support level at 76.01. Below this level, the market could move down to 74.12.
Read the full oil technical analysis report below.
Oil Technical Analysis
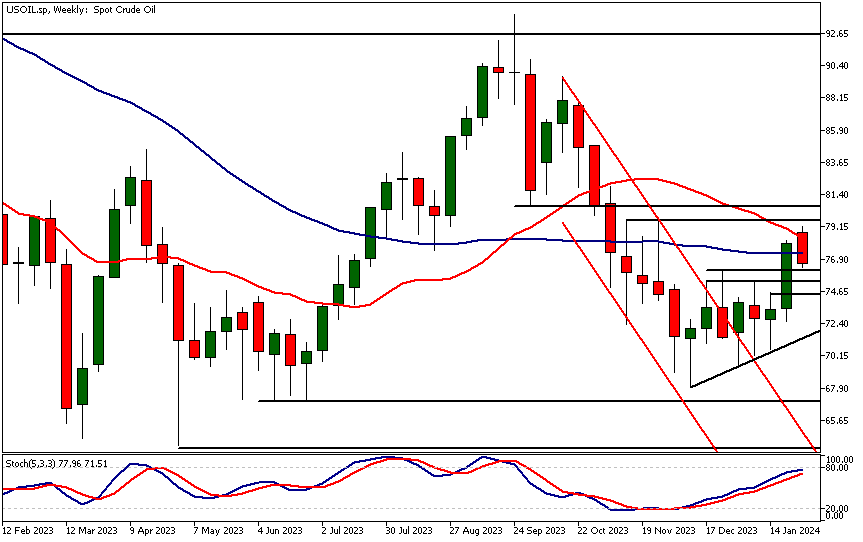
Weekly Oil Technical Analysis
Last week's candle is a bullish wide-range candle that suggests we could see further strength in the oil market. The market might retrace lower first though as the Evergrande mess has worried the markets. This increases risk of the market drifting lower to the 74.57 - 75.28 range. Should the market trade down to this range we will be monitoring the market for signs of institutional buying coming back into the market.
If the oil market attracts buyers around this range, weekly oil technical analysis suggests a move to the nearest key market structure at 79.58 - 80.62 could be likely. As USOIL created a higher reactionary low at 67.94 before breaking out of the consolidation formation.
This combination of technical factors indicates that the market could have the potential to push beyond the 79.58 - 80.62 range. This would open the way to 88 or so.
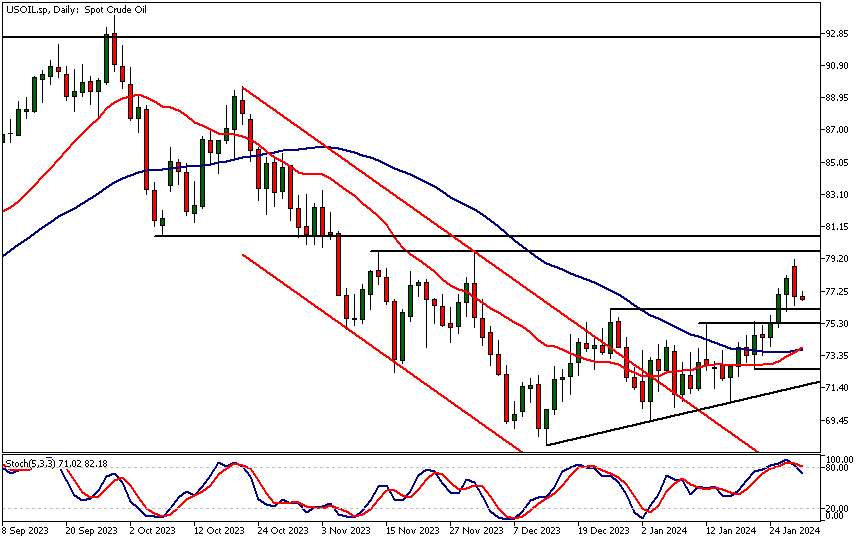
Daily Oil Technical Analysis
USOIL finally broke out of the consolidation formation we have focused on in the recent reports. The market rallied almost to the 79.58 resistance level before the Chinese Ever Grande troubles pressured the market yesterday. The decline was halted by the 76.18 support level.
If the level doesn't hold the oil technical analysis indicates the market could test the next key support level at 75.28. If there is renewed buying interest in the market at the 75.28 level, look for a push higher to the 79.58 - 80.62 range. Alternatively, USOIL might drop down to 73.60 or so.
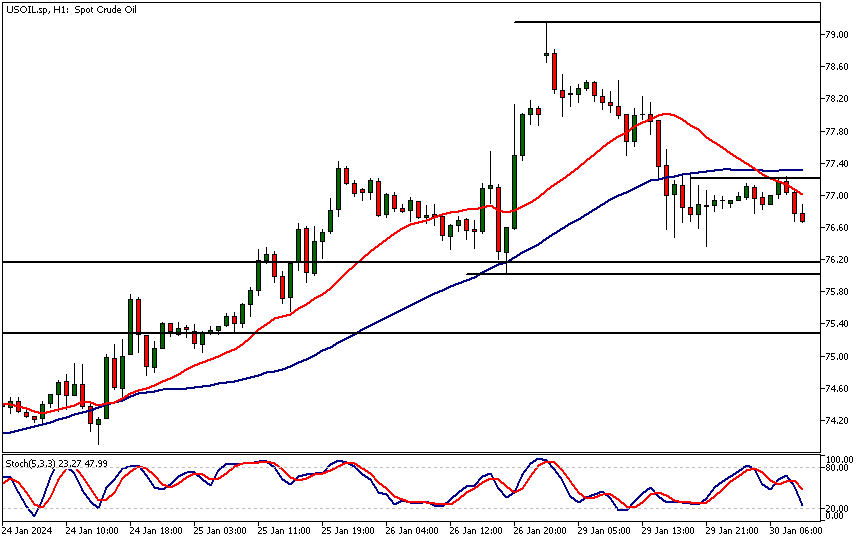
Intraday Oil Technical Analysis
The 1h chart shows how the market is hovering above the 76.18 market structure level but trades below the SMA 50. Our oil technical analysis suggests that if there's a decisive rally above the SMA 50, the oil bulls could be targeting the 78.23 intraday while swing traders might target the 79.58 - 80.62 range.
Alternatively, a failure to penetrate the SMA 50 could lead to the market breaking the nearest key support level at 76.01. Below this level, the market could move down to 74.12.
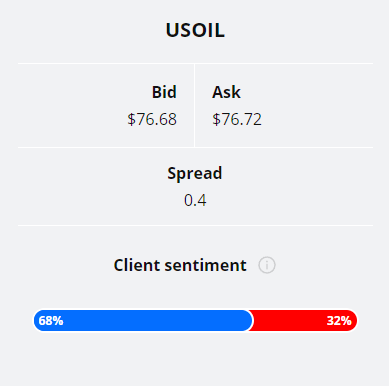
Client sentiment analysis
68% of clients trading Oil are holding long positions, while 32% are holding short positions. Client sentiment data is being provided by TIO Markets Ltd.
Please note that retail client trading sentiment is often said to be a contrarian indicator. This is because trade data suggests that private (non-professional) traders, on average, trade against market price trends. You can follow the TIOmarkets client sentiment live on our Forex dashboard.
The next key risk events impacting this market
- USD - ADP Non-Farm Employment Change
- USD - Chicago PMI
- USD - Crude Oil Inventories
- USD - Federal Funds Rate
- USD - FOMC Statement
- USD - ISM Manufacturing PMI
- USD - ISM Manufacturing Prices
- USD - Non-Farm Employment Change
- USD - Unemployment Rate
Potential Oil Market Moves
Our oil technical analysis suggests that if there's a decisive rally above the SMA 50, the oil bulls could be targeting the 78.23 intraday while swing traders might target the 79.58 - 80.62 range. Alternatively, a failure to penetrate the SMA 50 could lead to the market breaking the nearest key support level at 76.01. Below this level, the market could move down to 74.12.

How Would You Trade Oil Today?
I hope this Oil technical analysis helps you to make better informed trading decisions. Check the latest market analysis for other instruments and subscribe to receive them in your inbox as soon as they are published
DISCLAIMER: TIO Markets offers an exclusively execution-only service. The views expressed are for information purposes only. None of the content provided constitutes any form of investment advice. The comments are made available purely for educational and marketing purposes and do NOT constitute advice or investment recommendation (and should not be considered as such) and do not in any way constitute an invitation to acquire any financial instrument or product. TIOmarkets and its affiliates and consultants are not liable for any damages that may be caused by individual comments or statements by TIOmarkets analysis and assumes no liability with respect to the completeness and correctness of the content presented. The investor is solely responsible for the risk of his/her investment decisions. The analyses and comments presented do not include any consideration of your personal investment objectives, financial circumstances, or needs. The content has not been prepared in accordance with any legal requirements for financial analysis and must, therefore, be viewed by the reader as marketing information. TIOmarkets prohibits duplication or publication without explicit approval.

Janne Muta holds an M.Sc in finance and has over 20 years experience in analysing and trading the financial markets.
Related Posts


Trade responsibly: CFDs are complex instruments and come with a high risk of losing all your invested capital due to leverage.