Oil Technical Analysis | Weekly Bullish rejection candle
BY Janne Muta
|January 22, 2024Oil Technical Analysis - Oil price created yet another higher low last week due to the persistent conflicts in the Middle East and Ukraine, heightening supply risks. This uptick is juxtaposed against global economic challenges, notably affecting oil demand.
Oil market analysts highlight several factors that probably explain why there has not been a directional move in the price of oil lately. Instead the market is slowly building a base formation while hedge funds are cautiously buying oil.
Increased oil production and uncertain economic growth in China and Europe pressure the market. In the US, impending GDP data is expected to reveal a notable economic slowdown. At the same time though, oil demand forecasts for 2024 indicate an increase, ranging between 1.24 and 2.25 million barrels per day, though a deceleration in demand growth is anticipated for 2025.
Summary of This Oil Technical Analysis Report:
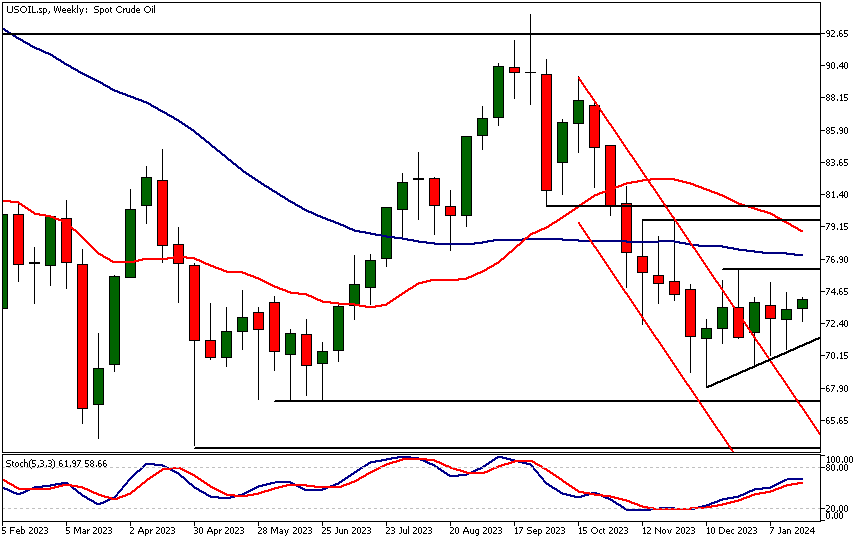
- Oil market created yet another bullish rejection candle last week signalling buying pressure. Oil technical analysis shows early bullish signals as a higher weekly low last week indicates institutional buyers are slowly lifting their bids week by week. This could result in a bullish breakout from the consolidation formation.
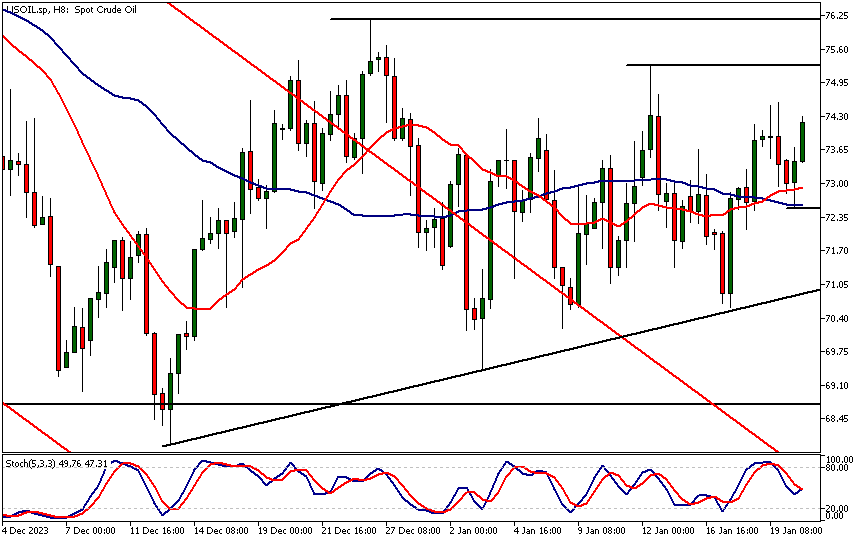
- The 8h chart shows a key price level at 72.53 that is closely aligned with the SMA 50 thus making it a significant price point. The market remains bullish above this higher swing low and could move to the next key resistance level at 75.28. Below the level, a move to the 71.60 could be likely. Moving averages-based oil technical analysis doesn't provide directional indications as the market continues to trade in a sideways range.
Read the full oil technical analysis report below.
Oil Technical Analysis
Weekly Oil Technical Analysis
Oil market created yet another bullish rejection candle last week signalling buying pressure. Oil technical analysis shows early bullish signals as a higher weekly low last week indicates institutional buyers are slowly lifting their bids week by week. This could result in a bullish breakout from the consolidation formation.
The top of the triangle pattern is situated at 76.18. Should the triangle break upwards, the market could move into the 72.33 - 80.62 bracket. Conversely, a downward breakout might lead the market to decline towards 66.93. The stochastic oscillator's upward trend is another early bullish sign. Meanwhile, the moving averages move sideways, reflecting the prolonged horizontal trend in the oil sector.
Daily Oil Technical Analysis
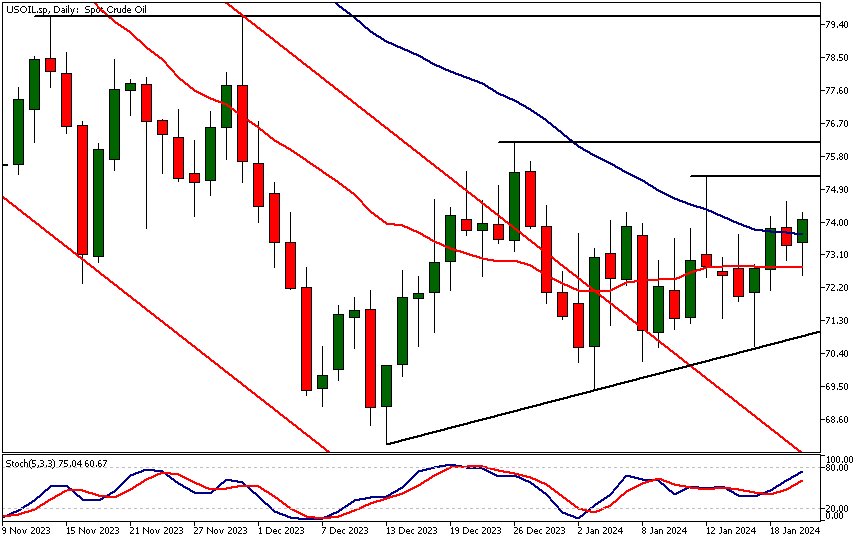
The daily chart shows two key levels that potentially still have supply around them. This supply needs to be cleared before the price can rally strongly and break out of the consolidation pattern. Oil technical analysis shows the impact of careful purchases of oil by hedge funds as the market continues to edge higher.
The defining moment though is the potential breakout from this basing formation. Once the institutions have accumulated enough oil the price will push through the 75.28 - 76.18 range.
Intraday Oil Technical Analysis
The 8h chart shows a key price level at 72.53 that is closely aligned with the SMA 50 thus making it a significant price point. The market remains bullish above this higher swing low and could move to the next key resistance level at 75.28. Below the level, a move to the 71.60 could be likely. Moving averages-based oil technical analysis doesn't provide directional indications as the market continues to trade in a sideways range.
The next key risk events impacting this market
- USD - Richmond Manufacturing Index
- USD - Flash Manufacturing PMI
- USD - Flash Services PMI
- USD - Advance GDP q/q
- USD - Core PCE Price Index m/m
Potential Oil Market Moves
The 8h chart shows a key price level at 72.53 that is closely aligned with the SMA 50 thus making it a significant price point. The market remains bullish above this higher swing low and could move to the next key resistance level at 75.28. Below the level, a move to the 71.60 could be likely. Moving averages-based oil technical analysis doesn't provide directional indications as the market continues to trade in a sideways range.

How Would You Trade Oil Today?
I hope this Oil technical analysis helps you to make better informed trading decisions. Check the latest market analysis for other instruments and subscribe to receive them in your inbox as soon as they are published
DISCLAIMER: TIO Markets offers an exclusively execution-only service. The views expressed are for information purposes only. None of the content provided constitutes any form of investment advice. The comments are made available purely for educational and marketing purposes and do NOT constitute advice or investment recommendation (and should not be considered as such) and do not in any way constitute an invitation to acquire any financial instrument or product. TIOmarkets and its affiliates and consultants are not liable for any damages that may be caused by individual comments or statements by TIOmarkets analysis and assumes no liability with respect to the completeness and correctness of the content presented. The investor is solely responsible for the risk of his/her investment decisions. The analyses and comments presented do not include any consideration of your personal investment objectives, financial circumstances, or needs. The content has not been prepared in accordance with any legal requirements for financial analysis and must, therefore, be viewed by the reader as marketing information. TIOmarkets prohibits duplication or publication without explicit approval.

Janne Muta holds an M.Sc in finance and has over 20 years experience in analysing and trading the financial markets.
Related Posts


Trade responsibly: CFDs are complex instruments and come with a high risk of losing all your invested capital due to leverage.