USDCAD Analysis | The market loses momentum at weekly resistance
BY Janne Muta
|November 21, 2023USDCAD Analysis - Canada's October CPI release is predicted to show inflation increasing by 0.1% after falling by 0.1% in September. The annual inflation is predicted to fall to 3.6% from 3.8% in September. All in all, the Canadian economy is facing a slowdown, with consumer spending increasing only marginally in Q3 2023 and the September retail sales data due on Friday is expected to show a contraction (-0.3% expected, 0.1% previous).
The Bank of Canada (BoC) has recognized the effects of previous rate hikes on the economy and inflation, highlighting the importance of not excessively tightening monetary policy. Given the latest less robust economic data, the BoC anticipates that inflation will decrease to 2% by 2025. However, it also notes potential upward pressure on inflation from factors such as rising energy costs and wage increases.
At the same time in the US, recent remarks by Federal Reserve officials suggest that additional rate hikes are still possible but markets remain sceptical. Fed funds futures market indicates that investors no longer anticipate further increases. This shift in expectation aligns with recent economic data indicating a slowdown and easing inflationary pressures.
Consequently, attention is now turning towards the potential timing of rate cuts by the central bank. The release of the Federal Reserve's latest meeting minutes is due tomorrow and hopefully, provide more insights into the Fed's future policy direction.
Summary of this USDCAD analysis report
- After trading higher since July, USDCAD has lost momentum upon reaching a major resistance level. The May high at 1.3862 proved to be a significant obstacle for the bulls, resulting in the market moving sideways below the level for the past three weeks.
- The USDCAD has formed a lower swing high after encountering weekly resistance at the end of October. This lower swing high aligns with the lower end of a bearish wedge (we analysed in the previous USDCAD report), suggesting that the market is turning bearish.
- All in all, the Canadian economy is facing a slowdown, with consumer spending increasing only marginally in Q3 2023 and the September retail sales data due on Friday is expected to show a contraction.
Read our full USDCAD analysis report below.
USDCAD Analysis
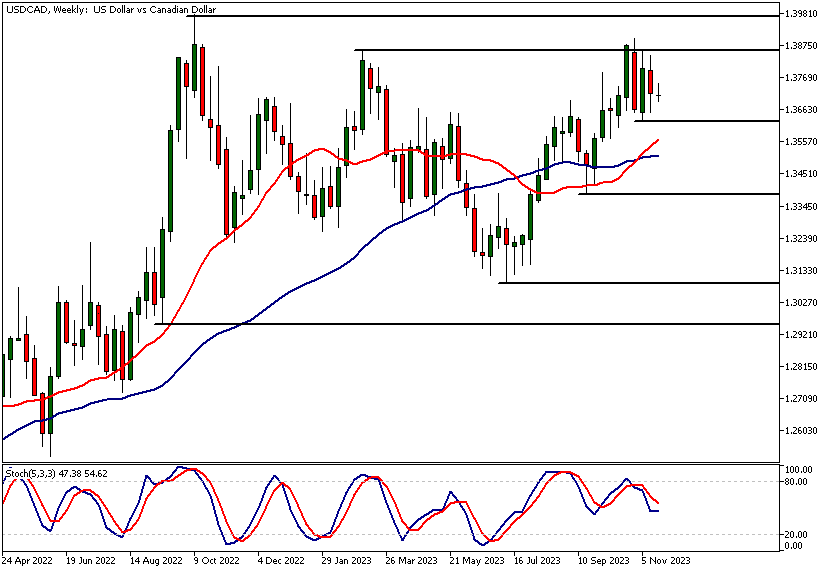
USDCAD Analysis, Weekly
After trading higher since July, USDCAD has lost momentum upon reaching a major resistance level. The May high at 1.3862 proved to be a significant obstacle for the bulls, resulting in the market moving sideways below the level for the past three weeks.
The formation of lower highs in the weekly candles indicates renewed selling pressure after rally attempts, suggesting the potential for the market to move lower. Our USDCAD analysis suggests that if the market falls below 1.3629, a decline to 1.3516 could occur. Conversely, 1,.3629 level, a move back to 1.3862 could be likely.
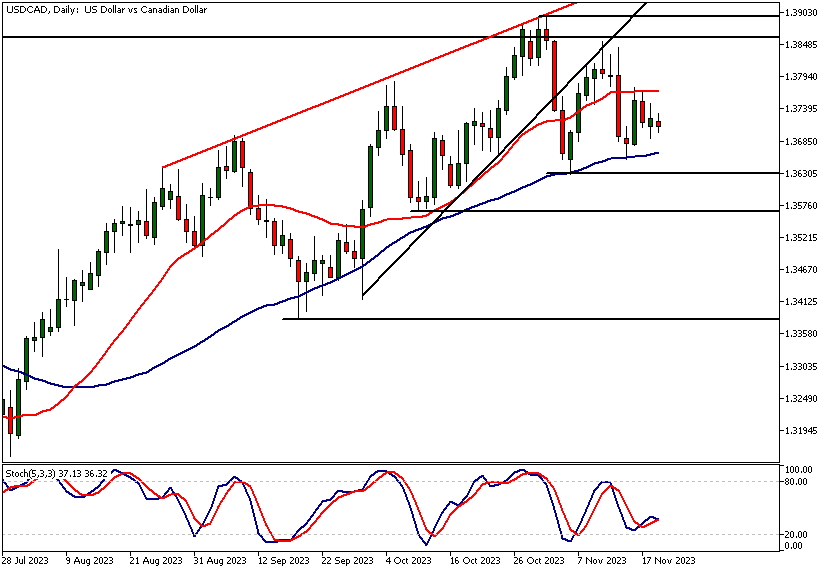
USDCAD Analysis, Daily
The USDCAD has formed a lower swing high after encountering weekly resistance at the end of October. This lower swing high aligns with the lower end of a bearish wedge (see our previous USDCAD analysis report), suggesting that the market is turning bearish.
The nearest key support level is at 1.3629, and with the lower swing high at 1.3854, the risk of the market trading below the 1.3629 level has increased. However, the market has also formed a higher reactionary low at 1.3654, giving mixed signals about the supply and demand balance. Currently, the market is moving sideways between 1.3629 and 1.3898.
The role of crude oil and Fed
If crude oil continues to strengthen and expectations for a Fed rate cut increase, this sideways movement might resolve to the downside. Additionally, USDCAD analysis indicates a measured move target at 1.3450, based on the triangle's width. Conversely, should the fundamentals shift in the opposite direction (US economy is after all quite strong), the market could retest the 1.3898 high. If there is a breakout above this high, a measured move target is projected at 1.4040.
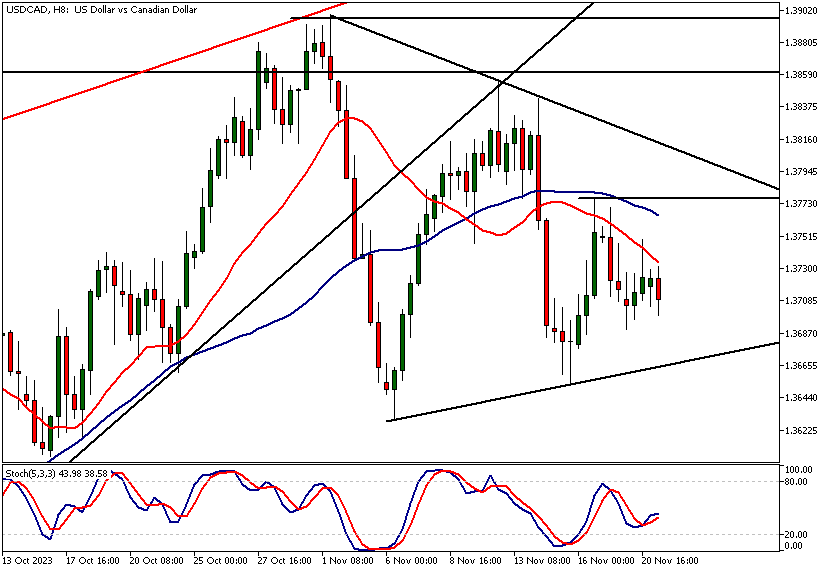
USDCAD Analysis, 8h
The 8-hour chart shows a developing triangle formation, as the market has simultaneously formed both a higher swing low and a lower swing high, indicating indecision. This could be related to the crude oil market trading near a major support area after a significant decline.
Canadian CPI release
The upcoming Canadian CPI release could further complicate trading in USDCAD today, as market participants await the inflation data for insights into potential Bank of Canada (BoC) future rate policies. The nearest key resistance level is at 1.3776, while the nearest key support level is at 1.3654.
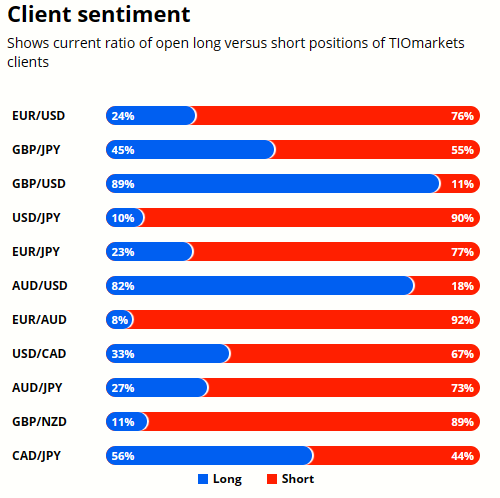
Client sentiment analysis
TIOmarkets clients are mostly bearish on USDCAD with 67% of clients holding short positions and 33% holding long positions in the market.
Please remember that the retail trader client sentiment is a contrarian indicator as most of the retail traders are on average betting against the market trends. This is why, experienced traders tend to trade against the retail client sentiment. You can follow the TIOmarkets client sentiment live on our Forex dashboard.
The Next Key Risk Events
- CAD - CPI
- USD - Existing Home Sales
- USD - FOMC Meeting Minutes
- USD - Unemployment Claims
- USD - Core Durable Goods Orders
- USD - Durable Goods Orders
- USD - Revised UoM Consumer Sentiment
- CAD - BOC Gov Macklem Speaks
- CAD - Core Retail Sales
- CAD - Retail Sales
- USD - Flash Manufacturing PMI
- USD - Flash Services PMI
Potential USDCAD market moves
If crude oil continues to strengthen and expectations for a Fed rate cut increase, this sideways movement might resolve to the downside. Additionally, USDCAD analysis indicates a measured move target at 1.3450, based on the triangle's width. Conversely, should the fundamentals shift in the opposite direction, the market could retest the 1.3898 high. If there is a breakout above this high, a measured move target is projected at 1.4040.
How would you trade USDCAD today?
I hope this fundamental and technical USDCAD analysis helps you make better informed trading decisions. Check the latest market analysis for other instruments and subscribe to receive them in your inbox as soon as they are published
DISCLAIMER: TIO Markets offers an exclusively execution-only service. The views expressed are for information purposes only. None of the content provided constitutes any form of investment advice. The comments are made available purely for educational and marketing purposes and do NOT constitute advice or investment recommendation (and should not be considered as such) and do not in any way constitute an invitation to acquire any financial instrument or product. TIOmarkets and its affiliates and consultants are not liable for any damages that may be caused by individual comments or statements by TIOmarkets analysis and assumes no liability with respect to the completeness and correctness of the content presented. The investor is solely responsible for the risk of his/her investment decisions. The analyses and comments presented do not include any consideration of your personal investment objectives, financial circumstances, or needs. The content has not been prepared in accordance with any legal requirements for financial analysis and must, therefore, be viewed by the reader as marketing information. TIOmarkets prohibits duplication or publication without explicit approval.

Janne Muta holds an M.Sc in finance and has over 20 years experience in analysing and trading the financial markets.
Related Posts


Trade responsibly: CFDs are complex instruments and come with a high risk of losing all your invested capital due to leverage.