USDCAD Analysis | USD rallies ahead of the Canadian CPI release
BY Janne Muta
|January 16, 2024USDCAD Analysis - Statistics Canada is set to release its December Consumer Price Index (CPI) report today. Economists had anticipated that the report would show a slight increase in Canada’s annual inflation rate for the month of December. In November, the inflation rate was recorded at 3.1 per cent.
The expected rise in December's inflation rate is primarily attributed to a lesser drop in gasoline prices compared to the same month in 2022. Other factors such as rents and mortgage interest costs were likely to continue pushing shelter prices upward.
However, there were indications that food price inflation was easing. It was also expected that airline fares, which weren’t as weak as usual in November, might not have risen as much in December as they typically do.
This trend suggested that overall inflationary pressures were becoming less broad-based, leading to a possible further deceleration in the Bank of Canada’s preferred CPI-trim and CPI-median measures of inflation.
Today's report is significant as it arrives just a week before the Bank of Canada’s next interest rate decision, scheduled for January 24. The data will likely influence the Bank's monetary policy decisions, especially considering the recent trends in inflation and economic activity in Canada.
Summary of this USDCAD analysis report
- USDCAD has rallied to the SMA(50) with strong momentum, and the stochastic oscillator is pointing higher, indicating upside momentum ahead of the Canada CPI report. The 50-period SMA is closely aligned with a weekly market structure level at 1.3480. If the market can maintain momentum above this level, we could see it moving to 1.3620. Alternatively, below 1.3480 look for a move down to 1.3380 and then perhaps to 1.3340 or so.
- The daily timeframe chart confirms the upside momentum indicated by the weekly chart. Today's wide-range candle signals strength if the daily close is above 1.3480. This obviously depends on the CPI release and the subsequent market reaction. The 1.3442 level is a key level as it earlier resisted the price advances. The nearest key resistance levels are at 1.3618 and 1.3654.
- The 1h chart shows a strong trend higher as the market has created higher reactionary lows and broken into new highs. The market trades inside a bullish trend channel with the moving averages pointing higher. The nearest support levels are at 1.3480 and 1.3442.
Read our full USDCAD analysis report below.
USDCAD Analysis
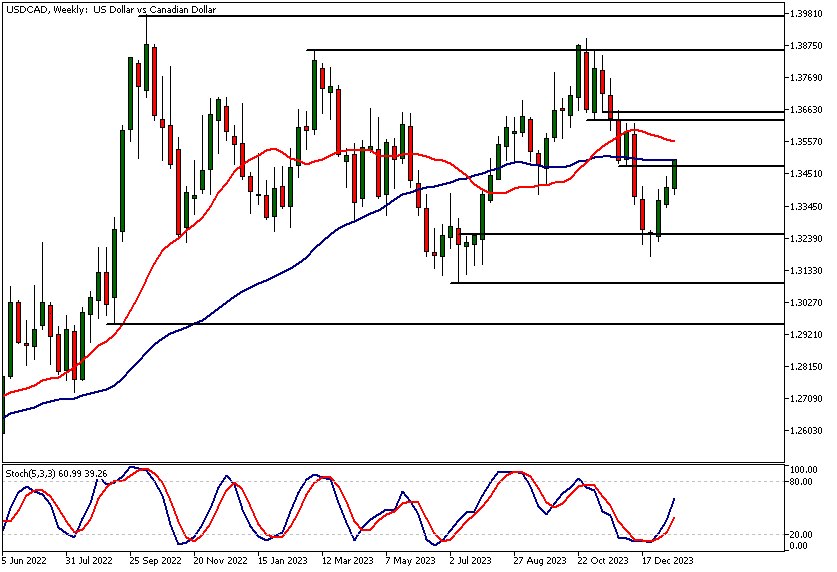
USDCAD Analysis, Weekly
USDCAD has rallied to the SMA(50) with strong momentum and has reached levels we anticipated in the previous USDCAD analysis report. The stochastic oscillator is pointing higher indicating upside momentum ahead of the Canada CPI report.
The 50-period SMA is closely aligned with a weekly market structure level at 1.3480. If the market can maintain momentum above this level, we could see it moving to 1.3620. Alternatively, below 1.3480 look for a move down to 1.3380 and then perhaps to 1.3340 or so.
Moving averages based USDCAD analysis shows the market trading in a wide weekly range with the moving averages pointing sideways roughly in the middle of the range.
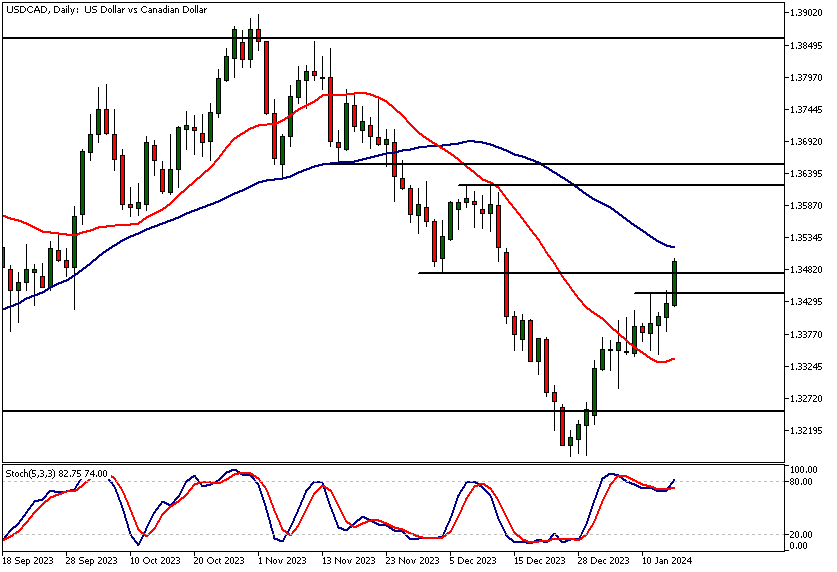
USDCAD Analysis, Daily
The daily timeframe chart confirms the upside momentum indicated by the weekly chart. Today's wide-range candle signals strength if the daily close is above 1.3480. This obviously depends on the CPI release and the subsequent market reaction.
As the market is trending higher potential pullbacks to key support levels could attract buyers. The 1.3442 level is a key level as it earlier resisted the price advances. The nearest key resistance levels are at 1.3618 and 1.3654. Our USDCAD analysis suggests that these levels could be targeted by the dollar bulls.
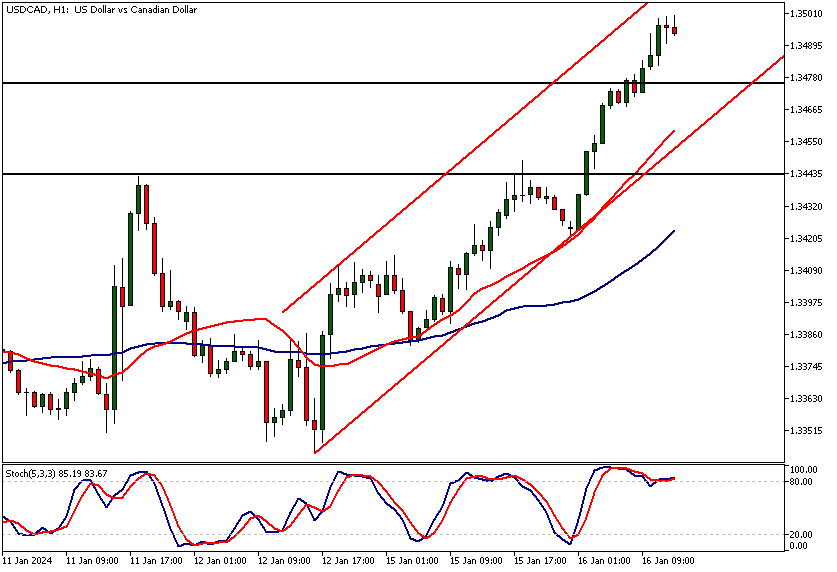
Intraday USDCAD Analysis
The 1h chart shows a strong trend higher as the market has created higher reactionary lows and broken into new highs. The market trades inside a bullish trend channel with the moving averages pointing higher and the SMA(20) is above the SMA(50), signalling strength. The nearest support levels are at 1.3480 and 1.3442. The levels are the same we identified in the daily USDCAD analysis above.
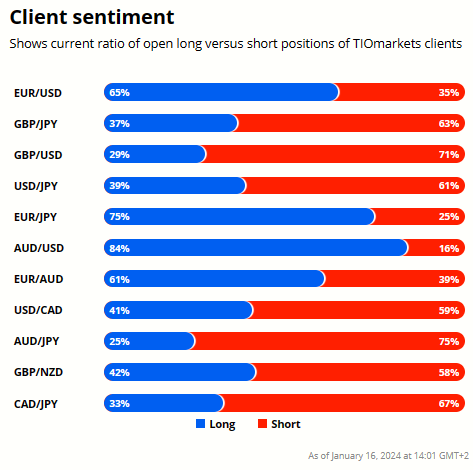
Client sentiment analysis
41% of clients trading USDCAD are holding long positions, while 59% are holding short positions. Client sentiment data is being provided by TIO Markets Ltd.
Please note that retail client trading sentiment is generally a contrarian indicator, as private (non professional) traders, on average, trade against market price trends. You can follow the TIOmarkets client sentiment live on our Forex dashboard.
The Next Key Risk Events
- CAD - CPI m/m
- CAD - Median CPI y/y
- CAD - Trimmed CPI y/y
- CAD - Common CPI y/y
- USD - Empire State Manufacturing Index
- WEF Annual Meetings
- USD - Core Retail Sales m/m
- USD - Retail Sales m/m
- USD - Industrial Production m/m
- WEF Annual Meetings
- USD - Unemployment Claims
- USD - Building Permits
- USD - Philly Fed Manufacturing Index
- WEF Annual Meetings
- CAD - Core Retail Sales m/m
- CAD - Retail Sales m/m
- USD - Prelim UoM Consumer Sentiment
- USD - Existing Home Sales
- USD - Prelim UoM Inflation Expectations
Potential USDCAD market moves
The market shows strong momentum with the stochastic oscillator pointing higher, potentially leading to an upward move above 1.3480 towards 1.3620. Alternatively, if the market fails to maintain momentum, dipping below 1.3480, possibly targeting 1.3380 and even 1.3340.

How Would You Trade USDCAD Today?
I hope this fundamental and technical USDCAD analysis helps you make better informed trading decisions. Check the latest market analysis for other instruments and subscribe to receive them in your inbox as soon as they are published
DISCLAIMER: TIO Markets offers an exclusively execution-only service. The views expressed are for information purposes only. None of the content provided constitutes any form of investment advice. The comments are made available purely for educational and marketing purposes and do NOT constitute advice or investment recommendation (and should not be considered as such) and do not in any way constitute an invitation to acquire any financial instrument or product. TIOmarkets and its affiliates and consultants are not liable for any damages that may be caused by individual comments or statements by TIOmarkets analysis and assumes no liability with respect to the completeness and correctness of the content presented. The investor is solely responsible for the risk of his/her investment decisions. The analyses and comments presented do not include any consideration of your personal investment objectives, financial circumstances, or needs. The content has not been prepared in accordance with any legal requirements for financial analysis and must, therefore, be viewed by the reader as marketing information. TIOmarkets prohibits duplication or publication without explicit approval.

Janne Muta holds an M.Sc in finance and has over 20 years experience in analysing and trading the financial markets.
Related Posts


Trade responsibly: CFDs are complex instruments and come with a high risk of losing all your invested capital due to leverage.