Best Trading Indicators for MT4 and MT5: A Practical Guide
BY Maria K.
|July 20, 2026Trading indicators are mathematical calculations applied to price or volume data and plotted on or below a chart. They are not predictions of future price. They are different ways of looking at recent price behaviour, designed to make particular patterns easier to see and quantify. MetaTrader 4 and MetaTrader 5 ship with a large library of built-in indicators that cover the four main categories used in technical analysis: trend, momentum, volatility and volume.
This guide covers what trading indicators for MT4 and MT5 are, the four main categories, the most widely-used indicators in each category, the distinction between leading and lagging indicators, how to choose and combine indicators sensibly, and how the indicator offering on MT4 differs from MT5.
What Are Trading Indicators?
A trading indicator takes a series of price or volume values and applies a formula to produce a new series that is plotted on the chart. The output may be a line overlaid on the price (for example, a moving average), a separate panel below the price (for example, the Relative Strength Index), or a set of dots, bands or histograms.
Indicators are descriptive, not predictive. A moving average shows where the average price has been over a given lookback period. It does not say what the price will do next. The value of an indicator comes from how the trader interprets it and how the rules they build around it interact with actual trading conditions.
Indicators are typically grouped into four categories by what they measure: trend (direction), momentum (rate of change), volatility (size of recent moves), and volume (participation). Most trading platforms, including MT4 and MT5, organise their built-in indicator menu along these lines, making it easier to find the right tool for a specific analytical question.
Categories of MT4 and MT5 Indicators
Trend indicators identify the direction of the prevailing move. They tend to be lagging by construction, since they require a number of historical bars to compute, but they help filter noise and define the dominant bias.
Momentum indicators, also called oscillators, measure the rate of price change. They often fluctuate within a bounded range and are used to identify overbought and oversold conditions, divergences between price and momentum, and shifts in the strength of a move.
Volatility indicators measure how widely the price has been moving. They are useful for setting stop-loss distances, sizing positions, and identifying breakouts from low-volatility ranges.
Volume indicators measure the participation behind a price move. In forex, the volume reported by MT4 and MT5 is tick volume (the count of price updates within each bar) rather than true contract volume, because there is no centralised forex exchange. Tick volume can be a useful proxy but is not the same as the contract volume reported for stocks, indices or commodities.
Popular Trend Indicators
Moving Averages
A moving average smooths price by averaging closing prices over a chosen lookback period. MT4 and MT5 both offer four types of moving average: Simple (SMA), Exponential (EMA), Smoothed (SMMA) and Linear Weighted (LWMA). The most common applications are using a single moving average as a trend filter (price above the MA implies an uptrend) and using two moving averages of different lengths to generate crossover signals. Popular lookback periods include 20, 50, 100 and 200 bars.
MACD
The Moving Average Convergence Divergence indicator plots the difference between two exponential moving averages, with a signal line and a histogram. The default settings on MT4 and MT5 are 12, 26 and 9. MACD is used to identify trend direction, momentum shifts (via the histogram), and divergences between price and the indicator.
Parabolic SAR
The Parabolic SAR plots a series of dots above or below price. When price crosses the dots, they flip to the other side, which is interpreted as a trend reversal signal. The default settings on MT4 and MT5 are a step of 0.02 and a maximum of 0.20. Parabolic SAR is often used as a trailing stop method in trending markets.
Average Directional Index (ADX)
The ADX measures the strength of a trend, not its direction. Readings above 25 are generally interpreted as a trending market; readings below 20 suggest a range. The default lookback period on MT4 and MT5 is 14. ADX is often combined with a directional indicator to confirm whether a trend signal is occurring in conditions strong enough to support it.
Ichimoku Kinko Hyo
Ichimoku is a complete trading system contained in a single indicator. It plots five lines, including the Tenkan-sen, Kijun-sen, Senkou Span A and B (which together form the cloud, or Kumo), and the Chikou Span. Default settings on MT4 and MT5 are 9, 26 and 52. Ichimoku is used to assess trend direction, support and resistance, and momentum simultaneously, though it has a steeper learning curve than simpler indicators.
Popular Momentum Indicators
Relative Strength Index (RSI)
The RSI measures the speed and change of price movements on a scale from 0 to 100. The default lookback period on MT4 and MT5 is 14. Levels above 70 are typically considered overbought and below 30 oversold, though these thresholds are guidelines rather than hard rules. RSI is also used to identify divergences between price and momentum, which are often watched as early reversal signals.
Stochastic Oscillator
The Stochastic compares the current closing price to the high-low range over a chosen lookback period, producing two lines (%K and %D) that oscillate between 0 and 100. The default settings on MT4 and MT5 are 5, 3 and 3 (for the slow stochastic). Levels above 80 are considered overbought and below 20 oversold. Crossovers of the two lines within those extremes are commonly used as entry signals.
Commodity Channel Index (CCI)
The CCI measures the deviation of price from its statistical average over a chosen period. The default lookback period is 14 on MT4 and MT5. CCI is not bounded like the RSI or Stochastic, but readings above +100 are typically interpreted as overbought and below -100 as oversold. It is used to identify cyclical trend changes and is named for its origins in commodity trading, though it applies to any market.
Williams %R
Williams Percent Range is similar to the Stochastic but on an inverted scale from 0 to -100. The default lookback period is 14. Readings between 0 and -20 are typically considered overbought and -80 to -100 oversold. Like the Stochastic, it is most useful in ranging or mean-reverting markets.
Popular Volatility Indicators
Bollinger Bands
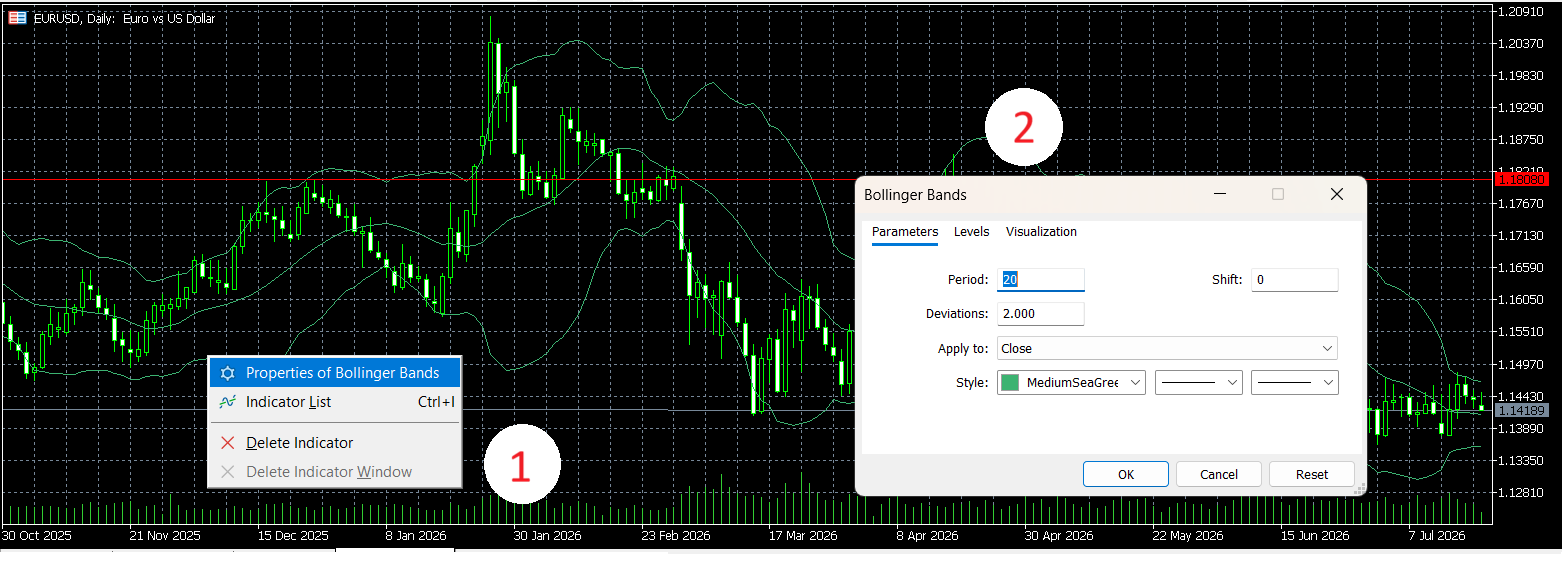
Bollinger Bands plot a moving average with two outer bands set a defined number of standard deviations above and below it. The default settings on MT4 and MT5 are a 20-period moving average and two standard deviations. Bollinger Bands widen during volatile periods and contract during quiet ones. The bands are used to identify volatility expansions, mean-reversion setups (when price touches a band), and breakouts when price closes outside a band that had previously been narrow.
Average True Range (ATR)
ATR measures the average size of price ranges over a chosen lookback period. The default is 14 on both MT4 and MT5. ATR does not indicate direction. It quantifies volatility. ATR is widely used to set stop-loss distances proportional to recent volatility, and to size positions consistently across instruments with very different price ranges.
Popular Volume Indicators
Volumes
The Volumes indicator plots the volume of each bar as a histogram below the chart. For stocks, indices and commodities at TIOmarkets, this represents contract volume. For forex, it represents tick volume, which is the number of price updates within each bar. Tick volume in forex correlates with actual trading activity but is not the same as exchange-reported contract volume.
On Balance Volume (OBV)
OBV is a cumulative indicator that adds the volume of up-bars and subtracts the volume of down-bars. The resulting line is meant to reflect buying and selling pressure over time. Divergences between price and OBV are often watched as potential trend exhaustion signals. The same tick-volume caveat applies for forex.
Accumulation/Distribution
The Accumulation/Distribution indicator combines price and volume to estimate whether a security is being accumulated (bought) or distributed (sold). It weights each bar's volume by where the close sits within the bar's range. Like OBV, it is most useful for identifying divergences and shifts in participation.
Leading vs Lagging Indicators
Indicators are often categorised as leading or lagging.
- Leading indicators attempt to signal a price move before it happens. Most oscillators, such as RSI, Stochastic, CCI and Williams %R, are loosely classified as leading because they can show overbought or oversold conditions that may precede a reversal. The tradeoff is that leading signals are more prone to false readings, particularly in trending markets where overbought conditions can persist for a long time.
- Lagging indicators confirm a move after it has begun. Moving averages, MACD and Parabolic SAR are common examples. They are more reliable as confirmation tools but produce signals after part of the move has already occurred.
In practice, most strategies use a combination, often a lagging trend filter with a leading momentum signal for entry timing.
How to Choose and Combine Indicators
The most common mistake with indicators is using too many of them, particularly multiple indicators from the same category. Two oscillators that both measure momentum (for example, RSI and Stochastic) will tend to give similar signals at similar times. Adding the second indicator does not provide independent confirmation. It adds visual clutter without analytical value.
A more effective approach is to combine indicators from different categories that answer different questions. A typical setup might include one trend indicator (such as a 50-period EMA or MACD) to define the bias, one momentum indicator (such as RSI) to identify timing, and one volatility indicator (such as ATR) to set stops and size positions. Each indicator contributes a different piece of information.
The choice of indicators should also be tied to the strategy and the market being traded. Trend-following strategies benefit from trend indicators and lagging confirmation. Mean-reversion strategies rely more on oscillators and volatility bands. Breakout strategies use volatility contractions and volume signals. There is no universal toolkit that works in every market and every condition.
Defaults are starting points, not optimal settings. The standard 14-period RSI, 20-period Bollinger Bands, or 12-26-9 MACD are conventions that have endured because they produce reasonable results on a wide range of instruments and timeframes, not because they are optimal for any specific case. Testing different parameters on the actual instrument and timeframe being traded is generally more useful than accepting defaults without question.
Indicators on MT4 vs MT5
MetaTrader 4 provides 30 built-in indicators. MetaTrader 5 provides 38, adding several specialised moving average types (such as Adaptive Moving Average and Double Exponential Moving Average), as well as additional volume-based and oscillator indicators.
Both platforms allow custom indicators to be added, either by writing them in MQL4 (for MT4) or MQL5 (for MT5), or by downloading them from the MQL5 community marketplace, which is a MetaQuotes service. Custom indicators are not compatible across the two platforms; an MQL4 indicator does not run on MT5 and vice versa.
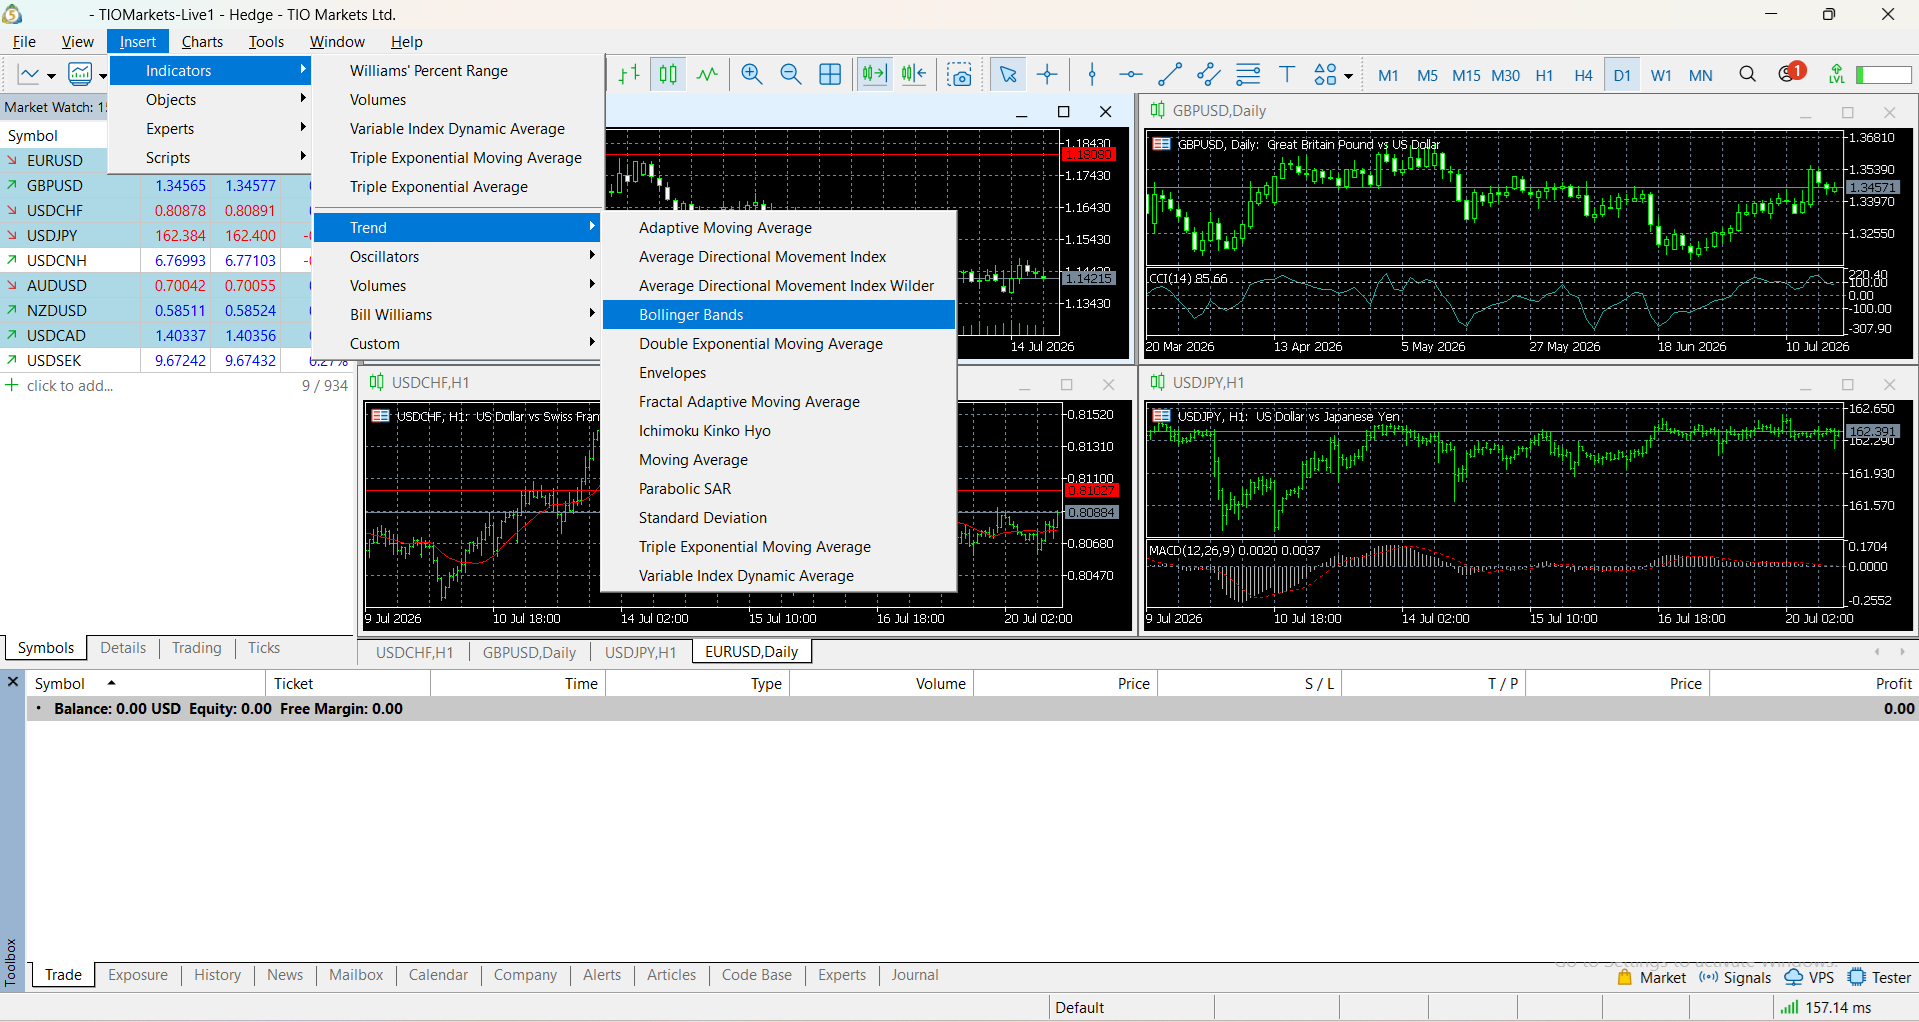
Indicators are accessed through the Insert menu under Indicators, or through the Navigator window.
On charts, indicators can be edited by right-clicking the indicator line and selecting Properties, allowing changes to lookback periods, smoothing methods, levels and colours.
Trading at TIOmarkets
All MT4 and MT5 built-in indicators are available across all instruments at TIOmarkets, including forex, indices, stocks, commodities and crypto CFDs. The Standard account is created automatically on registration, with a minimum deposit of $20 or currency equivalent. The Raw and VIP Black accounts are opened separately through the client area. All accounts support hedging. A swap-free Islamic account is available; contact TIOmarkets for eligibility and instrument requirements. Copy trading is available on both MT4 and MT5, allowing followers to copy strategy providers in real time.
Expert Advisors can be built to use any combination of built-in or custom indicators to automate signal generation on the desktop terminal of either platform. Mobile and web platforms display indicators on charts but do not run EAs.
Spreads are variable and are typically higher than minimum figures shown. Orders are executed at the best available market price, which may result in positive or negative slippage. Demo accounts often execute instantly and may not fully replicate live slippage conditions.
If you are ready, you can register your account with TIOmarkets here.

FAQ
Risk disclaimer: CFDs are complex instruments and come with a high risk of losing money rapidly due to leverage. You should consider whether you understand how CFDs work and whether you can afford to take the high risk of losing your money. Never deposit more than you are prepared to lose. Professional client’s losses can exceed their deposit. Please see our risk warning policy and seek independent professional advice if you do not fully understand. This information is not directed or intended for distribution to or use by residents of certain countries/jurisdictions including, but not limited to, USA & Countries included in the OFAC sanction list. The Company holds the right to alter the aforementioned list of countries at its own discretion.
TIOmarkets offers an exclusively execution-only service. The views expressed are for information purposes only. None of the content provided constitutes any form of investment advice. The comments are made available purely for educational and marketing purposes and do NOT constitute advice or investment recommendation (and should not be considered as such) and do not in any way constitute an invitation to acquire any financial instrument or product. TIOmarkets and its affiliates and consultants are not liable for any damages that may be caused by individual comments or statements by TIOmarkets analysis and assumes no liability with respect to the completeness and correctness of the content presented. The investor is solely responsible for the risk of his/her investment decisions. The analyses and comments presented do not include any consideration of your personal investment objectives, financial circumstances, or needs. The content has not been prepared in accordance with any legal requirements for financial analysis and must, therefore, be viewed by the reader as marketing information. TIOmarkets prohibits duplication or publication without explicit approval.
Join us on social media
Authors BIO

Maria is a writer and content strategist with over 10 years of experience in the finance industry. She specializes in developing research-backed articles that help financial professionals navigate complex market topics with confidence. Her expertise spans forex, stocks, CFDs and global markets, creating insightful content that educates readers and supports informed decision-making.


