Trend Reversal: What It Means and How to Spot It
BY Panagiotis Philippou
|June 8, 2026A trend reversal happens when the price of an asset changes direction and starts moving the other way.
If price has been rising and then begins to fall, that may be a bearish trend reversal. If price has been falling and then begins to rise, that may be a bullish trend reversal.
For beginners, the simple answer is this: a trend reversal is when the market stops moving in one direction and starts building a new trend in the opposite direction.
Trading is risky. Trend reversal signals do not guarantee future price movement.

What Is a Trend?
Before understanding a trend reversal, it helps to understand what a trend is.
A trend is the general direction of price over time.
| Trend Type | What it Means |
| Uptrend | Price is generally making higher highs and higher lows |
| Downtrend | Price is generally making lower highs and lower lows |
| Sideways trend | Price is moving within a range without a clear direction |
A trend reversal matters because it may suggest that the previous direction is weakening and a new direction may be starting.
Trend Reversal Explained in Simple Terms
Think of a trend like a road.
If a car is driving uphill, that is like an uptrend. If the car slows down, turns around and starts driving downhill, that is like a trend reversal.
In trading, the same idea applies. Prices may rise for a while, then buyers lose strength and sellers take control. Or price may fall for a while, then sellers lose strength and buyers take control.
The important point is that a reversal is not just one candle or one small move. A real trend reversal usually needs more evidence that the market direction has changed.
Interactive Brokers defines a trend reversal as a clear change in the direction of the prevailing price trend of an asset or market.
Trend Reversal vs Pullback
A pullback is a temporary move against the current trend. A trend reversal is a larger change where the original trend may be ending.
| Price Move | Meaning | Example |
| Pullback | Temporary pause or correction | Price rises, dips slightly, then continues rising |
| Trend reversal | Possible change in main direction | Price rises, breaks structure, then starts falling |
This is one of the most important differences for beginners. Not every move against the trend is a reversal. Sometimes the market is only taking a short break before continuing in the same direction.
Bullish vs Bearish Trend Reversal
There are two main types of trend reversal.
| Type | What It Means |
| Bullish reversal | Price may change from a downtrend to an uptrend |
| Bearish reversal | Price may change from an uptrend to a downtrend |
Bullish trend reversal example
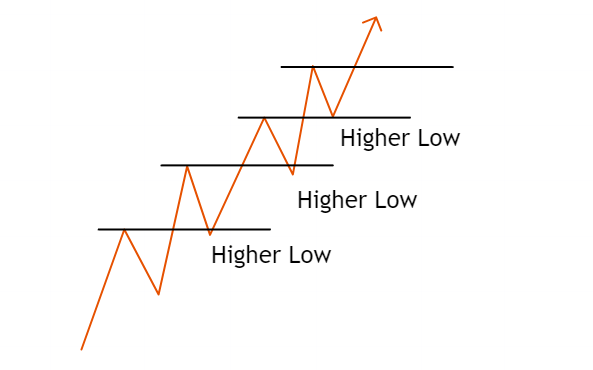
Imagine EUR/USD has been falling for several days. Then price stops making lower lows, forms a higher low, breaks above a short-term resistance level and starts moving upward.
That may be a bullish trend reversal.
Bearish trend reversal example
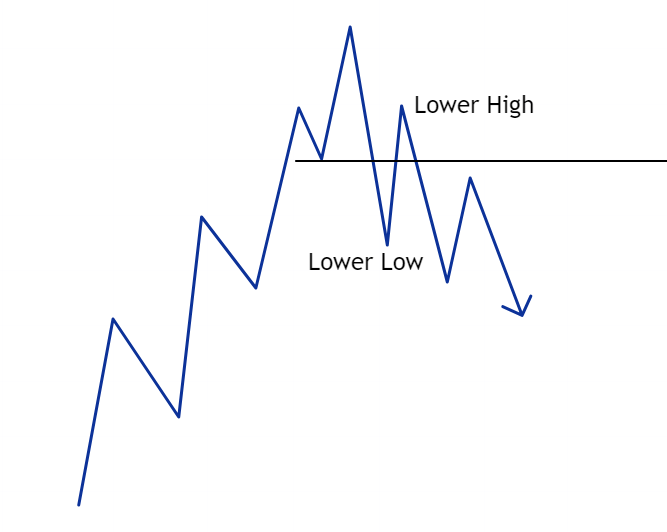
Imagine gold has been rising for several sessions. Then the price fails to make a new high, breaks below support and starts making lower highs and lower lows.
That may be a bearish trend reversal.
Common Signs of a Trend Reversal
Traders usually look for several clues before deciding that a trend reversal may be happening.
1. The trendline breaks
A trendline connects major highs or lows on a chart. If price breaks through an important trendline, it may be an early sign that the trend is weakening.
A trendline break alone is not enough. Traders often wait to see whether price continues in the new direction.
2. Price structure changes
Price structure is one of the simplest ways to read a trend.
In an uptrend, price usually makes higher highs and higher lows. If price starts making lower highs and lower lows, the uptrend may be reversing.
In a downtrend, price usually makes lower highs and lower lows. If price starts making higher highs and higher lows, the downtrend may be reversing.
3. Momentum slows down
A trend may weaken before it reverses. For example, prices may still be rising, but each move higher becomes smaller.
This can show that buyers or sellers are losing strength.
4. RSI divergence appears
The Relative Strength Index, or RSI, is a momentum indicator. Some traders use it to look for possible reversal signals.
A basic example is bearish divergence. Price makes a higher high, but RSI makes a lower high. This can suggest that upward momentum is weakening.
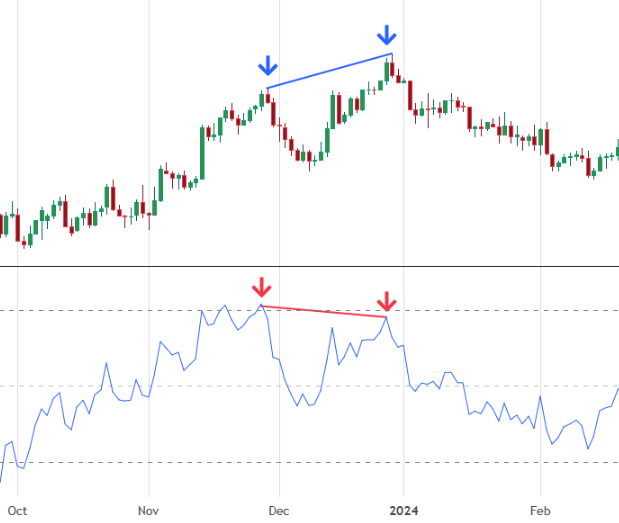
In this example, price forms a higher high while the RSI forms a lower high. This suggests that although buyers pushed price to a new high, the momentum behind the move was weaker than before. The later decline shows why bearish divergence is often treated as a warning sign rather than a standalone sell signal.
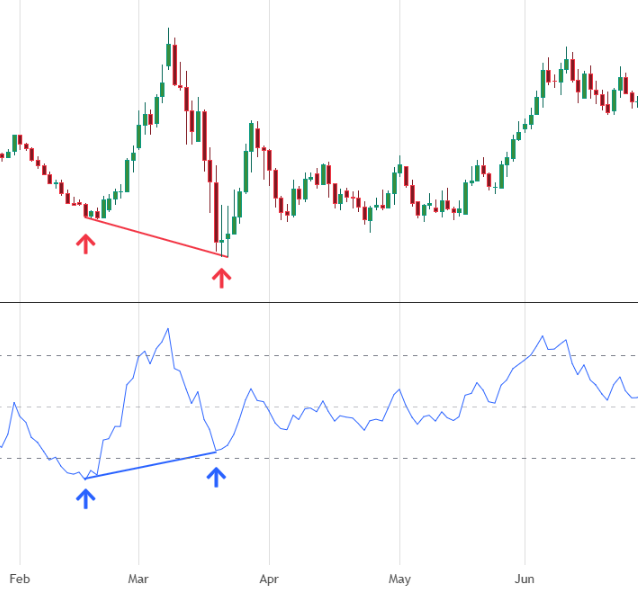
In this example, price forms a lower low while the RSI forms a higher low. This suggests that although sellers pushed price to a new low, the momentum behind the move was weaker than before. The later recovery shows why bullish divergence is often treated as a warning sign that selling pressure may be fading, rather than a standalone buy signal.
A basic bullish divergence happens when price makes a lower low, but RSI makes a higher low. This can suggest that downward momentum is weakening.
5. Support or resistance breaks
Support is an area where price has previously found buyers. Resistance is an area where price has previously found sellers.
If price breaks below support after an uptrend, it may suggest sellers are gaining control. If price breaks above resistance after a downtrend, it may suggest buyers are gaining control.
Simple Trend Reversal Example
Imagine a market has been rising like this:
- Price makes a higher high.
- Price pulls back and makes a higher low.
- Price rises again but fails to make a strong new high.
- Price breaks below the previous higher low.
- Price starts making lower highs and lower lows.
At that point, traders may start viewing the move as a possible bearish trend reversal.
The reverse can happen after a downtrend. If price stops making lower lows, forms a higher low and breaks above resistance, traders may watch for a possible bullish reversal.
How Traders Use Trend Reversals
Traders use trend reversals to help decide when a market direction may be changing.
A trader may use reversal signals to:
- Exit a trade when the previous trend weakens
- Look for a new trade in the opposite direction
- Avoid entering late into an old trend
- Confirm that price structure has changed
However, traders should avoid acting too early. Many reversals fail, and some moves that look like reversals are only pullbacks.
Common Mistakes Beginners Make
Mistake 1: Calling every pullback a reversal
A small move against the trend does not always mean the trend has changed. Beginners often mistake normal pullbacks for reversals.
Mistake 2: Entering before confirmation
Trying to catch the exact top or bottom is risky. It is usually safer to wait for stronger confirmation, such as a structure break, trendline break or momentum signal.
Mistake 3: Ignoring the bigger trend
A chart may show a short-term reversal, while the larger trend remains unchanged. Always check the broader market context.
Mistake 4: Using one signal alone
No single signal confirms a reversal. A trendline break, RSI signal or support break is more useful when it appears with other evidence.
Trend Reversal Checklist
Before treating a move as a possible trend reversal, ask:
| Question | Why It Matters |
| Has price broken an important trendline? | Shows the old trend may be weakening |
| Has the price structure changed? | Higher highs/lows or lower highs/lows show trend direction |
| Has support or resistance broken? | Confirms price is moving into a new area |
| Is momentum weakening? | Shows the old trend may be losing strength |
| Is there RSI divergence? | Can show momentum is not confirming price |
| Is this just a pullback? | Helps avoid entering too early |
The more evidence there is, the stronger the reversal case may be.
Final Thoughts
A trend reversal happens when price changes direction and begins forming a new trend.
For beginners, the key is to avoid calling every small move a reversal. A real reversal usually needs confirmation, such as a change in price structure, a trendline break, a support or resistance break, or weakening momentum.
Trend reversals can help traders spot potential turning points, but they are never guaranteed. The safest approach is to wait for confirmation, manage risk and avoid trying to predict exact tops or bottoms. You can put what you learned in use by opening an account with TIOmarkets.

FAQ
Risk disclaimer: CFDs are complex instruments and come with a high risk of losing money rapidly due to leverage. You should consider whether you understand how CFDs work and whether you can afford to take the high risk of losing your money. Never deposit more than you are prepared to lose. Professional client’s losses can exceed their deposit. Please see our risk warning policy and seek independent professional advice if you do not fully understand. This information is not directed or intended for distribution to or use by residents of certain countries/jurisdictions including, but not limited to, USA & Countries included in the OFAC sanction list. The Company holds the right to alter the aforementioned list of countries at its own discretion.
TIOmarkets offers an exclusively execution-only service. The views expressed are for information purposes only. None of the content provided constitutes any form of investment advice. The comments are made available purely for educational and marketing purposes and do NOT constitute advice or investment recommendation (and should not be considered as such) and do not in any way constitute an invitation to acquire any financial instrument or product. TIOmarkets and its affiliates and consultants are not liable for any damages that may be caused by individual comments or statements by TIOmarkets analysis and assumes no liability with respect to the completeness and correctness of the content presented. The investor is solely responsible for the risk of his/her investment decisions. The analyses and comments presented do not include any consideration of your personal investment objectives, financial circumstances, or needs. The content has not been prepared in accordance with any legal requirements for financial analysis and must, therefore, be viewed by the reader as marketing information. TIOmarkets prohibits duplication or publication without explicit approval.
Join us on social media
Authors BIO

Panagiotis is an online trading specialist with extensive experience in forex, indices, and commodities. He enjoys sharing his experience to help traders better understand global financial markets.


