Most Traded Commodities in the World: 2026 Guide
BY Panagiotis Philippou
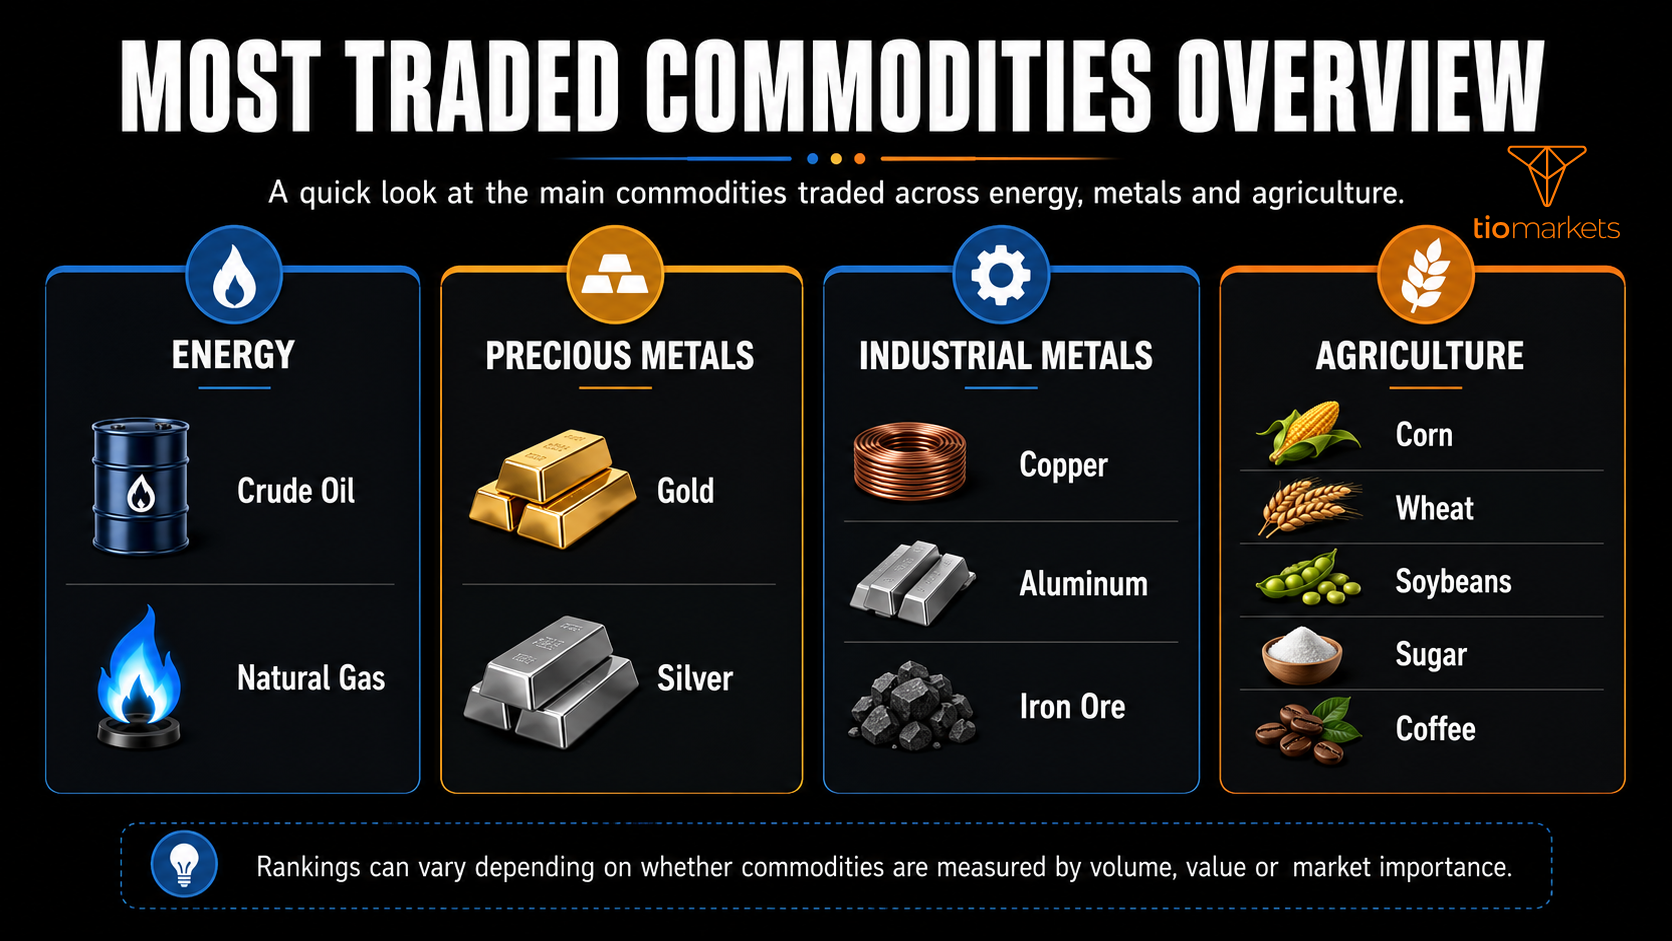
|June 12, 2026The most traded commodities in the world include crude oil, natural gas, gold, copper, silver, aluminum, corn, wheat, soybeans, sugar, coffee and iron ore.
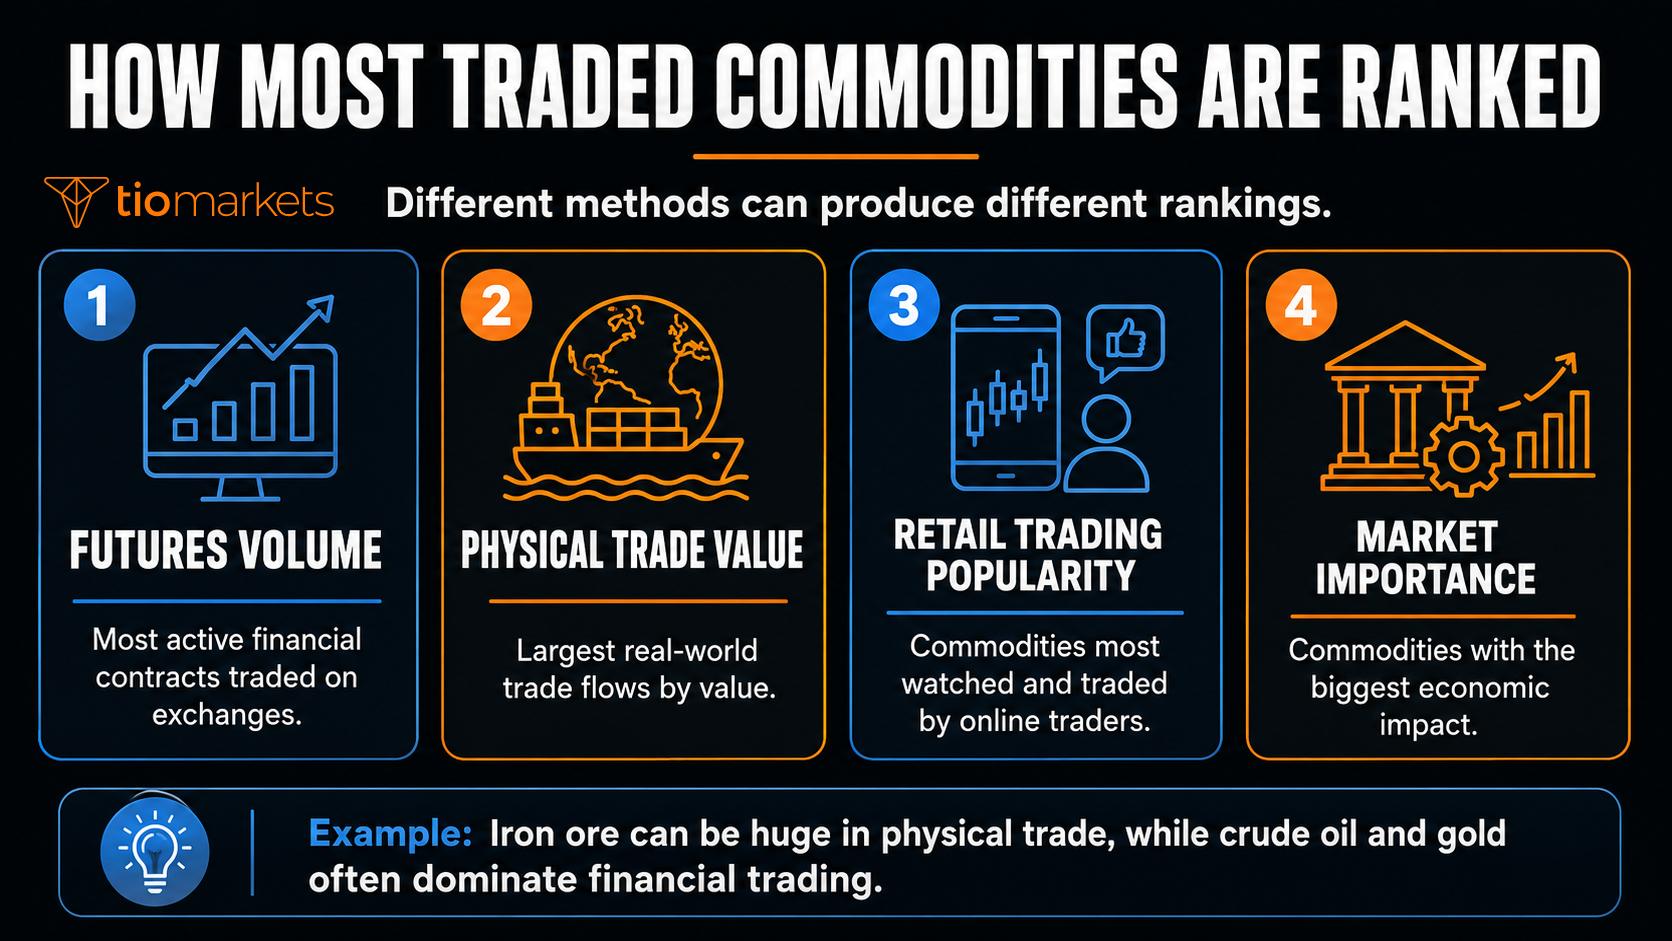
Crude oil is usually considered the most traded commodity globally because of its role in energy, transport, industry, inflation and geopolitics. However, commodity rankings can change depending on how “most traded” is measured.
Some rankings are based on futures trading volume. Others focus on physical trade value, global demand, production flows, retail trading popularity or market liquidity. This is why one list may place crude oil first, while another may highlight gold, natural gas, iron ore or agricultural commodities.
This guide explains the most traded commodities, why they are heavily traded, what drives their prices and how beginners can track commodity markets more effectively.
Quick Answer: What Is the Most Traded Commodity?
The most traded commodity in the world is generally crude oil.
Crude oil dominates global commodity markets because it is essential for transport, energy production, petrochemicals, manufacturing and global trade. It is also highly sensitive to economic growth, interest rates, inflation, OPEC+ decisions, supply disruptions and geopolitical risk.
The two main crude oil benchmarks are WTI crude oil and Brent crude oil. WTI is commonly used as a benchmark for US oil prices, while Brent is widely used as a global benchmark for oil traded internationally.
Other heavily traded commodities include:
- Natural gas
- Gold
- Copper
- Silver
- Aluminum
- Corn
- Wheat
- Soybeans
- Sugar
- Coffee
- Iron ore
Crude oil may lead overall, but gold often attracts the most attention during periods of uncertainty, while copper is closely watched as a signal of industrial demand and global growth.
Most Traded Commodities Ranked
There is no single perfect ranking of the world’s most traded commodities because different sources use different metrics. Still, the following commodities regularly appear in global trading, futures market and retail trading lists.
| Rank | Commodity | Category | Common Benchmarks / Symbols | Why It Is Heavily Traded | Main Price Drivers |
| 1 | Crude Oil | Energy | WTI, Brent | Essential global energy commodity | OPEC+, inventories, demand, geopolitics |
| 2 | Natural Gas | Energy | Henry Hub, TTF | Key fuel for heating, power and LNG trade | Weather, storage, LNG flows, supply shocks |
| 3 | Gold | Precious Metal | XAU/USD, COMEX Gold | Safe-haven and inflation-sensitive asset | Interest rates, USD, central banks, risk sentiment |
| 4 | Copper | Industrial Metal | COMEX Copper, LME Copper | Used in construction, grids, EVs and manufacturing | China demand, mine supply, growth outlook |
| 5 | Silver | Precious / Industrial Metal | XAG/USD, COMEX Silver | Investment and industrial demand | Gold prices, solar demand, USD, rates |
| 6 | Aluminum | Industrial Metal | LME Aluminum | Used in packaging, transport and construction | Energy costs, China demand, production limits |
| 7 | Corn | Agriculture | CBOT Corn | Food, animal feed and ethanol input | Weather, USDA reports, biofuel policy |
| 8 | Wheat | Agriculture | CBOT Wheat | Staple food and food security commodity | Weather, export controls, Russia/Ukraine supply |
| 9 | Soybeans | Agriculture | CBOT Soybeans | Animal feed, vegetable oil and biofuel input | China demand, Brazil/US harvests, trade policy |
| 10 | Sugar | Agriculture | ICE Sugar | Food manufacturing and ethanol production | Brazil/India output, weather, currencies |
| 11 | Coffee | Agriculture | Arabica, Robusta | Popular soft commodity with global demand | Brazil/Vietnam supply, climate risk, crop disease |
| 12 | Iron Ore | Industrial Metal | SGX Iron Ore, Dalian Iron Ore | Critical input for steelmaking | China steel demand, Australia/Brazil exports |
This ranking is best understood as a practical overview rather than a strict global league table. Crude oil, natural gas, gold, copper and major agricultural commodities are consistently among the most important markets, but the order can change depending on whether the ranking is based on futures volume, physical trade value or retail trading demand.
How We Define “Most Traded”
The phrase most traded commodities can mean several different things. This is one of the main reasons commodity rankings vary.
A commodity can be considered heavily traded because it has high futures volume, large physical trade flows, strong retail trading interest or major global economic importance.
The most common ways to measure commodity trading activity are:
| Metric | What It Measures | Why It Matters |
| Futures trading volume | Number of contracts traded | Shows activity in financial markets |
| Open interest | Number of active contracts | Shows market depth and participation |
| Physical trade value | Value of real-world imports and exports | Shows global economic importance |
| Global consumption | How much the world uses the commodity | Shows structural demand |
| Retail trading popularity | How often traders follow or trade it | Shows accessibility and market attention |
| Liquidity | How easily it can be bought or sold | Important for spreads and execution |
For example, iron ore is huge in physical trade because it is essential for steelmaking, especially in China. But it may be less visible in retail trading lists than gold, crude oil or natural gas.
On the other hand, gold may not be the most consumed commodity, but it is one of the most watched financial commodities because it reacts to inflation, interest rates, the US dollar and market uncertainty.
Can We Rank Commodities by Exchange Volume?
We can use futures exchange data as one ranking method, but volumes are usually tied to specific benchmark contracts.
| Commodity | Main futures benchmark | Average Volume |
| WTI Crude Oil | WTI Crude Oil Futures | 900,000 contracts |
| Brent Crude Oil | Brent Crude Futures | 1.000.000 lots daily |
| Natural Gas | Henry Hub Natural Gas Futures | 400,000 contracts |
| Gold | Gold Futures | 27 million ounces |
| Silver | Silver Futures | 57,000 contracts |
| Copper | Copper Futures | 67,000 contracts |
| Corn | Corn Futures | 520,000 contracts |
| Wheat | Wheat Futures | 187,000 contracts |
| Soybeans | Soybean Futures | 280,000 contracts |
| Sugar | Sugar Futures | 94,686 contracts |
| Coffee | Coffee Futures | 22,900 contracts |
| Aluminum | LME Aluminum | 268,000 lots |
| Iron Ore | Iron Ore Futures | 325,000 contracts |
The average volume figures shown in this table are approximate and were calculated from the most recently available daily volume data displayed on the relevant exchange or market data source at the time of review. Data was checked in June 2026 using sources such as CME Group, ICE, LME and SGX, depending on the futures contract.
Energy Commodities
Energy commodities are among the most traded markets in the world because they affect transport, production costs, inflation and economic growth.
Crude Oil
Crude oil is usually the most traded commodity globally. It is used in fuel, transport, heating, petrochemicals and industrial production.
The two most important benchmarks are WTI crude oil and Brent crude oil. WTI is more closely linked to the US market, while Brent is widely used as an international oil benchmark.
Oil prices are heavily influenced by OPEC+ production decisions, inventory reports, global demand expectations, shipping routes, war risk and changes in economic growth. Because oil affects inflation and business costs, it is also closely watched by central banks, governments and traders.
Natural Gas
Natural gas is another major energy commodity. It is used for heating, electricity generation, industrial production and liquefied natural gas exports.
Unlike crude oil, natural gas prices can vary significantly by region. US prices, European gas prices and Asian LNG prices may behave differently depending on local storage levels, pipeline flows, weather and export capacity.
Natural gas is especially sensitive to seasonal demand. Cold winters, hot summers, storage shortages or geopolitical supply disruptions can create sharp price moves.
Precious Metals
Precious metals are widely traded because they combine financial, industrial and safe-haven demand.
Gold
Gold is one of the most traded and closely watched commodities in the world. It is often seen as a safe-haven asset during market uncertainty.
Gold prices are influenced by interest rates, inflation expectations, the US dollar, central bank buying and investor demand. When real yields fall or market uncertainty rises, gold often becomes more attractive to investors.
Gold is also popular with traders because it can move strongly during major economic releases, central bank decisions and periods of geopolitical tension.
Silver
Silver has both investment and industrial demand. Like gold, it can attract safe-haven interest, but it is also used in electronics, solar panels, medical equipment and industrial applications.
Because silver has a smaller market than gold and stronger industrial exposure, it can be more volatile. This makes it attractive to some traders, but it also means risk can increase quickly.
Industrial Metals
Industrial metals are closely linked to manufacturing, construction, infrastructure and global economic growth.
Copper
Copper is one of the most important industrial metals. It is often called an economic indicator because it is used in construction, electrical wiring, power grids, electric vehicles and manufacturing.
Copper demand is closely linked to China, global infrastructure spending and the energy transition. Mine supply disruptions in major producing regions can also affect prices.
When traders expect stronger global growth, copper often attracts more attention. When recession fears rise, copper prices may come under pressure.
Aluminum
Aluminum is widely used in packaging, transport, construction, aerospace and manufacturing. It is lighter than steel and highly versatile, which makes it important across many industries.
Aluminum production is energy-intensive, so prices can be affected by electricity costs, supply restrictions and production changes in major producing countries. Demand from China and global manufacturing activity are also important drivers.
Iron Ore
Iron ore is a key raw material used to make steel. It is one of the most important commodities in physical global trade, even if it is not always as visible in retail trading lists.
China is a major source of iron ore demand because of its steel and construction sectors. Australia and Brazil are major exporters, so supply disruptions in either country can affect global prices.
Iron ore shows why “most traded” can be complicated. It is massive in physical trade, but many retail traders are more familiar with commodities such as oil, gold, silver and natural gas.
Agricultural Commodities
Agricultural commodities are heavily traded because they are tied to food, animal feed, energy policy and global supply chains.
Corn
Corn is used for food, animal feed and ethanol production. Its price is affected by weather, planting conditions, harvest expectations, biofuel policy and agricultural reports.
Because corn is tied to both food and energy markets, it can react to changes in crop forecasts and fuel demand.
Wheat
Wheat is one of the world’s most important food commodities. It is central to food security and is widely used in bread, pasta and other staple products.
Wheat prices can be affected by droughts, export restrictions, shipping disruptions and geopolitical tensions. Supply from major producing regions is especially important because shortages can quickly affect global food prices.
Soybeans
Soybeans are used for animal feed, vegetable oil and biofuels. They are heavily traded because of strong demand from food production, livestock markets and energy-related uses.
China is a major source of soybean demand, while the US and Brazil are key suppliers. Trade policy, weather and harvest conditions can all create large price moves.
Sugar
Sugar is used in food manufacturing and can also be linked to ethanol production. Brazil, India and Thailand are major producers, making their weather conditions and export policies important for prices.
Currency moves can also affect sugar prices because production costs and export competitiveness can change when local currencies move against the US dollar.
Coffee
Coffee is one of the most popular soft commodities. The two main types are Arabica and Robusta.
Brazil is a major Arabica producer, while Vietnam is especially important for Robusta. Coffee prices can be affected by weather, crop disease, shipping costs, consumer demand and climate-related risks.
Hard vs Soft Commodities
Commodities are often divided into hard commodities and soft commodities.
Hard commodities are usually mined or extracted. This includes energy products and metals such as crude oil, natural gas, gold, copper, aluminum and iron ore.
Soft commodities are usually grown or farmed. This includes agricultural goods such as wheat, corn, soybeans, sugar, coffee and cotton.
| Commodity Type | Examples | Main Price Drivers |
| Hard commodities | Oil, gas, gold, copper, aluminum | Supply, demand, geopolitics, rates, industrial activity |
| Soft commodities | Wheat, corn, soybeans, coffee, sugar | Weather, harvests, crop disease, export policy |
Hard commodities are often more closely linked to industrial growth, energy demand and infrastructure. Soft commodities are more sensitive to weather, crop cycles and food supply conditions.
Where Are Commodities Traded?
Commodities are traded on major global exchanges, through futures contracts, spot markets, forwards, ETFs and derivatives such as CFDs.
Some of the most important commodity trading venues include:
| Exchange / Venue | Common Commodity Markets |
| NYMEX | Brent crude, sugar, coffee and other soft commodities |
| CME / CBOT | Corn, wheat, soybeans and other agricultural futures |
| COMEX | Gold, silver, copper |
| LME | Aluminum, copper and other industrial metals |
| Dalian Commodity Exchange | Iron ore and other China-linked commodities |
| Shanghai Futures Exchange | Metals and energy-related contracts |
| Singapore Exchange | Iron ore derivatives |
The most relevant venue depends on the commodity. For example, oil traders often watch WTI and Brent benchmarks, while agricultural traders may follow CBOT contracts and metals traders may watch COMEX or LME prices.
What Drives Commodity Trading Volume?
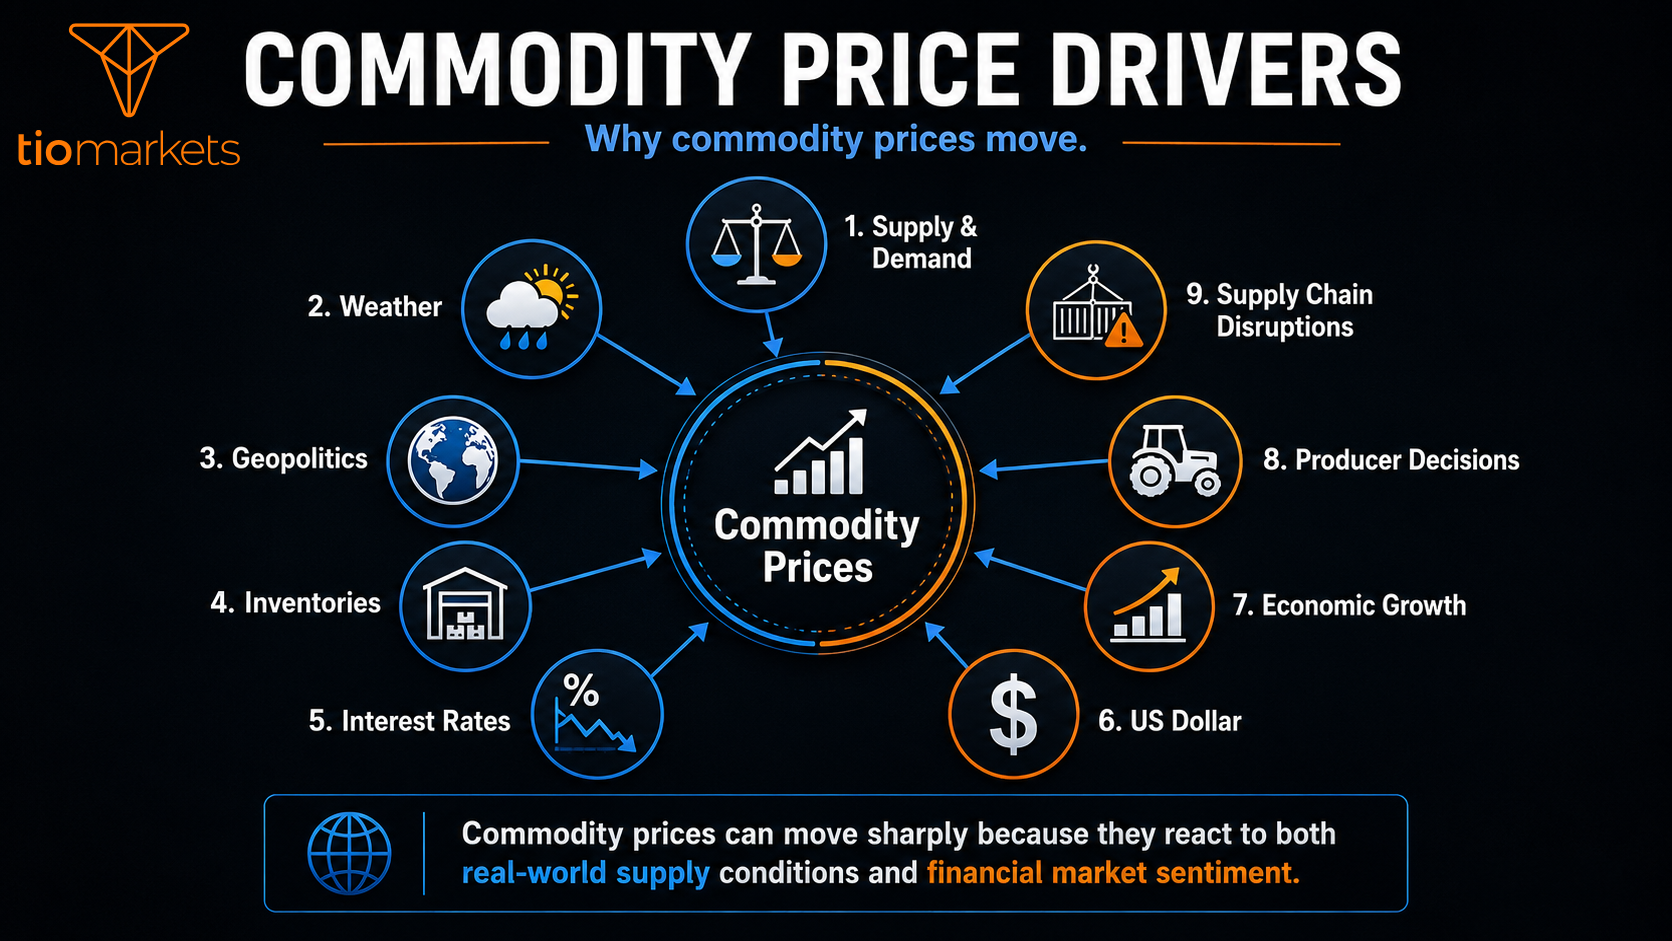
Commodity trading volume is driven by a mix of real-world demand, financial speculation, hedging and macroeconomic conditions.
Producers and consumers use commodity markets to manage price risk. For example, airlines may want to manage fuel price exposure, while farmers and food producers may use futures markets to manage agricultural price changes.
Traders and investors are also drawn to commodities because prices can react strongly to global events. A supply disruption, weather shock, central bank decision or change in the US dollar can quickly affect commodity prices.
The main drivers of commodity trading activity include:
- liquidity,
- volatility,
- hedging demand,
- speculation,
- inflation expectations,
- weather,
- geopolitics,
- currency movements,
- interest rates,
- inventory data,
- supply chain disruptions,
- and global growth expectations.
This is why commodities can be active in both calm and uncertain markets. They are linked to real-world demand, but they also respond to financial market sentiment.
Most Traded Commodities by Category
Looking at commodities by category makes the market easier to understand.
Most traded energy commodities
| Commodity | Why Traders Watch It |
| Crude Oil | Global energy demand, inflation and geopolitics |
| Natural Gas | Weather, storage, LNG flows and supply shocks |
| Gasoline | Transport demand and refinery activity |
| Heating Oil | Seasonal demand and energy costs |
Most traded metals
| Commodity | Why Traders Watch It |
| Gold | Safe-haven demand, inflation and interest rates |
| Silver | Investment and industrial demand |
| Copper | Global growth, construction and electrification |
| Aluminum | Manufacturing, packaging and energy costs |
| Iron Ore | Steelmaking and China demand |
Most traded agricultural commodities
| Commodity | Why Traders Watch It |
| Corn | Food, feed and ethanol demand |
| Wheat | Food security and global supply risk |
| Soybeans | Animal feed, oil and China demand |
| Sugar | Food production and ethanol links |
| Coffee | Weather, crop risk and consumer demand |
These category tables are useful because different commodities respond to different market forces. Oil may move on geopolitical supply risk, while wheat may react to droughts or export restrictions, and gold may move on interest rates or risk sentiment.
Most Traded vs Most Valuable Commodities
The most traded commodity is not always the same as the most valuable commodity.
A commodity may have very high futures trading volume because it is liquid, volatile and easy for traders to access. Another commodity may have huge physical trade value because it is essential to global industry, even if it is less common among retail traders.
For example, crude oil and gold are extremely visible in financial markets. They are widely followed, actively traded and often used by traders to react to macroeconomic events.
Iron ore, however, is massive in physical trade because it is essential for steelmaking. But it is less visible on many retail trading platforms than oil, gold, silver or natural gas.
This is why commodity lists can differ. One ranking may focus on financial trading volume, while another may focus on physical trade, production value or market size.
How Beginners Can Track Commodity Markets
Beginners do not need to follow every commodity at once. A better approach is to focus on a small group of major markets and learn what drives them.
For example, a beginner might track crude oil for energy and inflation, gold for safe-haven demand, copper for global growth and wheat or soybeans for agricultural market trends.
Useful things to watch include:
| Market Indicator | Why It Matters |
| Futures prices | Show market expectations and active pricing |
| Spot prices | Reflect current market value |
| Inventory reports | Important for oil, gas and metals |
| OPEC+ meetings | Can affect crude oil supply expectations |
| USDA reports | Important for corn, wheat and soybeans |
| Weather data | Key driver for agriculture and natural gas |
| China demand indicators | Important for copper, iron ore and soybeans |
| US dollar index | Commodities are often priced in USD |
| Interest rates | Important for gold and broad market sentiment |
| ETF flows | Can show investor demand for some commodities |
The key is to understand the main driver behind each commodity. Oil reacts differently from coffee. Gold reacts differently from corn. Copper reacts differently from natural gas.
Final Thoughts: What Are the Most Traded Commodities?
The most traded commodities in the world include crude oil, natural gas, gold, copper, silver, aluminum, corn, wheat, soybeans, sugar, coffee and iron ore.
Crude oil is generally considered the top commodity because of its global economic importance, high liquidity and sensitivity to energy demand, inflation and geopolitics.
However, the answer depends on how “most traded” is measured. Gold is one of the most watched financial commodities. Natural gas is highly active and volatile. Copper is closely linked to global growth. Agricultural commodities such as wheat, corn and soybeans are essential to food supply and global trade.
The best way to understand commodity markets is to separate them by category, track the main price drivers and avoid assuming that one ranking tells the full story.
Ready to get started? Open your trading account with TIOmarkets and put what you learned to use

FAQ
Risk disclaimer: CFDs are complex instruments and come with a high risk of losing money rapidly due to leverage. You should consider whether you understand how CFDs work and whether you can afford to take the high risk of losing your money. Never deposit more than you are prepared to lose. Professional client’s losses can exceed their deposit. Please see our risk warning policy and seek independent professional advice if you do not fully understand. This information is not directed or intended for distribution to or use by residents of certain countries/jurisdictions including, but not limited to, USA & Countries included in the OFAC sanction list. The Company holds the right to alter the aforementioned list of countries at its own discretion.
TIOmarkets offers an exclusively execution-only service. The views expressed are for information purposes only. None of the content provided constitutes any form of investment advice. The comments are made available purely for educational and marketing purposes and do NOT constitute advice or investment recommendation (and should not be considered as such) and do not in any way constitute an invitation to acquire any financial instrument or product. TIOmarkets and its affiliates and consultants are not liable for any damages that may be caused by individual comments or statements by TIOmarkets analysis and assumes no liability with respect to the completeness and correctness of the content presented. The investor is solely responsible for the risk of his/her investment decisions. The analyses and comments presented do not include any consideration of your personal investment objectives, financial circumstances, or needs. The content has not been prepared in accordance with any legal requirements for financial analysis and must, therefore, be viewed by the reader as marketing information. TIOmarkets prohibits duplication or publication without explicit approval.
Join us on social media
Authors BIO

Panagiotis is an online trading specialist with extensive experience in forex, indices, and commodities. He enjoys sharing his experience to help traders better understand global financial markets.


