


Gold Price Analysis: Rebound to $4,350 Before CPI as Oil Tops $100
BY Ahmed Osama
|September 11, 2026Gold trades in the $4,300 to $4,400 area, near $4,350, recovering after testing $4,300 in early Friday trade, its weakest level in more than a week.
Thursday's producer price data triggered the decline. The annual rate came in at 5.4%, above the 5.3% expected, lifting Federal Reserve rate-hike expectations and the dollar with them. Gold fell about 0.90% on the session.
Two forces now converge. Brent and WTI crude have both pushed above $100, adding to inflation concerns, while the August consumer price report lands today at 12:30 GMT, the final major inflation reading before the Federal Reserve meets on 15-16 September.
This gold price analysis examines a detail most coverage is missing: the headline and core inflation numbers are expected to move in opposite directions.
Gold Market Highlights
- XAU/USD near $4,350, after testing $4,300 early Friday, its lowest in over a week
- Thursday's PPI annual rate reached 5.4%, above the 5.3% forecast, lifting the dollar
- But PPI core monthly came in at 0.2%, below the 0.3% expected, a softer detail the headline obscured
- Brent and WTI have both cleared $100, feeding energy-driven inflation concerns
- August CPI is released today at 12:30 GMT, the last major input before the Fed decision
- Headline CPI is forecast to accelerate to 0.4% monthly, while core annual is expected to ease to 2.4% from 2.5%
- Price is consolidating around the 100-day moving average near $4,339
What moved the gold price this week
The decline has a specific and dateable cause.
The August producer price index, released Thursday, was mixed rather than uniformly hot:
- Headline monthly: 0.4%, matching forecasts
- Headline annual: 5.4%, above the 5.3% expected
- Core monthly: 0.2%, below the 0.3% estimate
- Core annual: 4.6%, in line
The market traded the headline. The annual beat lifted Federal Reserve hike expectations, the dollar firmed, and gold retreated roughly 0.90% on the day before testing $4,300 overnight.
The softer core figure received far less attention, which matters because core strips out the volatile energy component that is currently doing most of the work.
Two additional pressures compounded the move. Brent and WTI crude both rose above $100, a level that mechanically raises inflation expectations, and Treasury yields climbed alongside.
Why today's CPI split matters for the gold price
This is the detail that frames the next move, and most previews are treating the release as a single number.
It is not. Two numbers are expected to diverge:
| Measure | Expected direction |
| Headline monthly | Accelerating to 0.4% from 0.1% |
| Headline annual | Broadly unchanged near 3.4% |
| Core monthly | Steady at 0.2% |
| Core annual | Easing to 2.4% from 2.5% |
The headline acceleration is expected to come from energy, which is consistent with crude above $100. The core measure, which excludes food and energy, is forecast to slow.
Why the distinction matters: energy-driven inflation is supply-side and largely outside the Federal Reserve's control. Core inflation reflects underlying demand pressure, which policy can address.
Three outcomes are worth thinking through:
- Hot headline, cooling core: the expected outcome. Ambiguous for policy, and the market reaction may depend on which number commentators lead with
- Hot on both: would strengthen the hike case materially
- Soft on both: would challenge the repricing that followed Jackson Hole and the August payrolls report
The context is that a September hike is genuinely live. Warsh's hawkish Jackson Hole address followed by a payrolls print of 162,000 against a forecast near 56,000 has put it back on the table, and today's reading is the last major input before Tuesday's meeting begins.
XAU/USD technical analysis
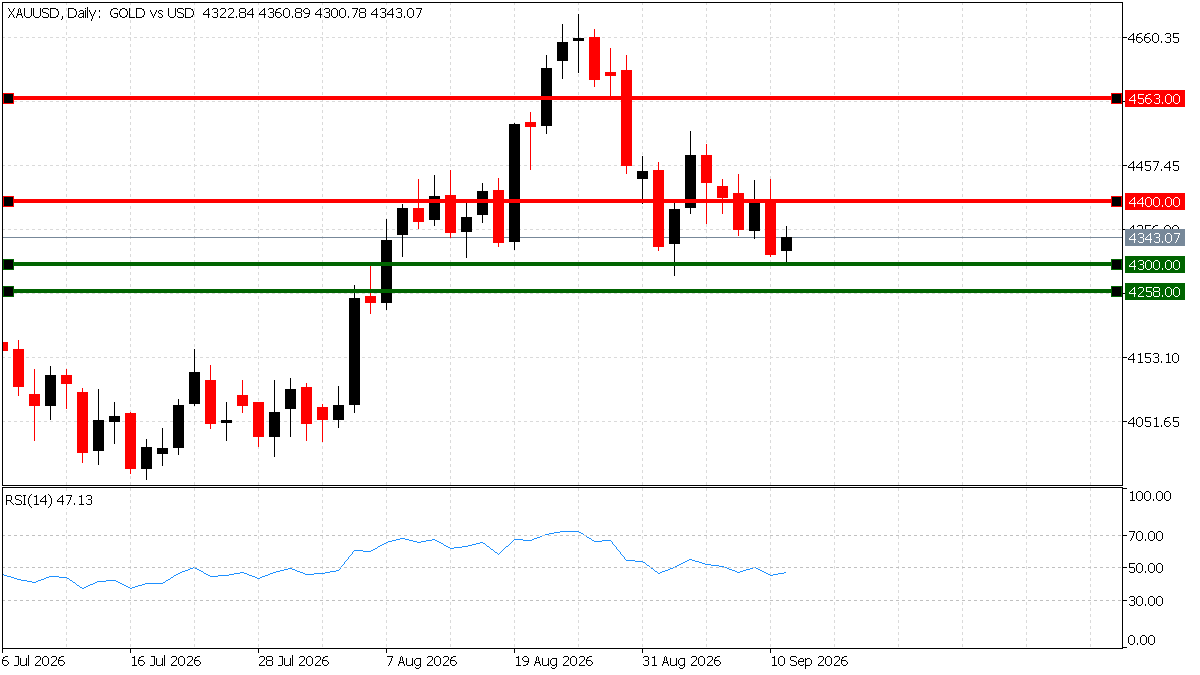
Source: TIOmarkets MT5 live XAU/USD chart, 11 September 2026.
Gold has been consolidating around a key moving average after breaking beneath its recent range.
Price sits close to the 100-day moving average near $4,339. That level held through Thursday's decline and prevented a test of the $4,282 low from 2 September.
Momentum has turned. The Relative Strength Index has flipped bearish on the daily chart, having previously supported sideways trading. That does not force a direction, but it removes the cushion that a neutral reading provides.
Resistance levels to watch:
- $4,400: the first round-number barrier on any recovery
- $4,466: the 20-day average area, lost during the recent decline
- $4,536: the 200-day moving average, the more significant structural level
Support levels to watch:
- $4,339: the 100-day moving average, the immediate pivot
- $4,300: tested early Friday and defended
- $4,282: the 2 September low, the level that would confirm a deeper break
- $4,258: the lower band reference
The read: gold has broken beneath its prior range, which is a negative development, but it has held the 100-day average and defended $4,300 on the first test. That combination describes a market under pressure rather than one in decline.
Gold price forecast for the days ahead: bullish scenario
Any gold price forecast for the days ahead depends on today's inflation reading and the Federal Reserve outcome that follows.
This bullish scenario may strengthen if the core reading comes in at or below the 2.4% expectation and the headline acceleration is visibly energy-driven, allowing markets to discount it as supply-side.
A recovery above $4,400 would be the first signal, with $4,466 the next reference and the $4,536 average beyond it.
Supporting factors include a retreat in the dollar from its PPI-driven gains, softer Treasury yields, a reduction in September hike expectations, or safe-haven demand should Middle East developments escalate further.
Invalidation: a daily close beneath $4,300 would weaken this scenario, and a break of $4,282 would remove it.
Gold price forecast for the days ahead: bearish scenario
This bearish scenario may strengthen if both headline and core come in above expectations, confirming that inflation pressure extends beyond energy.
A break beneath $4,300 would expose the $4,282 September low, and a close below that would bring $4,258 into focus.
Supporting factors include further dollar strength, rising real yields, crude holding above $100 while core inflation firms, or a hawkish Federal Reserve outcome next week.
Invalidation: a reclaim of $4,400 and a hold above it would challenge this view.
A note on market mechanics. Gold is a non-yielding asset priced against expected real rates, which is why an inflation reading moves it through two channels at once: the inflation number itself and the policy response it implies. Those channels can point in opposite directions, and today's expected headline-versus-core split is precisely such a case.
Track Live XAU/USD Levels
Monitor gold prices and manage your trades directly from your smartphone.
Trading is risky
Key gold price levels and catalysts
- Resistance: $4,400, then $4,466, then $4,536
- Support: $4,339, then $4,300, then $4,282, then $4,258
- Today, 11 September, 12:30 GMT: US consumer price index for August
- Today: University of Michigan preliminary consumer sentiment and inflation expectations
- 15-16 September: Federal Reserve policy meeting, decision and updated projections
- Ongoing: crude above $100, Treasury yields, the dollar, Middle East developments
Conclusion
Gold has recovered toward $4,350 after a producer price report lifted the dollar and pushed the metal to a one-week low near $4,300.
The detail worth carrying into today's release is that headline and core inflation are expected to move in opposite directions, with energy driving the headline higher while core eases. Which number the market chooses to trade will shape the reaction.
Technically, the picture is pressured but not broken. The 100-day average near $4,339 is holding and $4,300 was defended on the first test, though momentum has turned and the prior range has been lost.
With the Federal Reserve meeting on Tuesday, today's reading is the last substantial input before that decision, which makes it the most consequential release of the week.

FAQ
Risk disclaimer: CFDs are complex instruments and come with a high risk of losing money rapidly due to leverage. You should consider whether you understand how CFDs work and whether you can afford to take the high risk of losing your money. Never deposit more than you are prepared to lose. Professional client’s losses can exceed their deposit. Please see our risk warning policy and seek independent professional advice if you do not fully understand. This information is not directed or intended for distribution to or use by residents of certain countries/jurisdictions including, but not limited to, USA & Countries included in the OFAC sanction list. The Company holds the right to alter the aforementioned list of countries at its own discretion.
TIOmarkets offers an exclusively execution-only service. The views expressed are for information purposes only. None of the content provided constitutes any form of investment advice. The comments are made available purely for educational and marketing purposes and do NOT constitute advice or investment recommendation (and should not be considered as such) and do not in any way constitute an invitation to acquire any financial instrument or product. TIOmarkets and its affiliates and consultants are not liable for any damages that may be caused by individual comments or statements by TIOmarkets analysis and assumes no liability with respect to the completeness and correctness of the content presented. The investor is solely responsible for the risk of his/her investment decisions. The analyses and comments presented do not include any consideration of your personal investment objectives, financial circumstances, or needs. The content has not been prepared in accordance with any legal requirements for financial analysis and must, therefore, be viewed by the reader as marketing information. TIOmarkets prohibits duplication or publication without explicit approval.
Join us on social media



Authors BIO

An experienced financial analyst and educator with over 8 years of expertise covering gold, forex, and global financial markets. Ahmed specializes in blending price action analysis with macroeconomic data to accurately interpret market movements, providing readers with comprehensive educational insights into trading and the financial world.





