


S&P 500 (SP500) Market Analysis
BY Eleni Antoniou
|July 29, 2026The S&P 500 closed at 7,434 yesterday, July 28th, 2026, up 15.60 points or about 0.21%, after a tight daily range. As of July 29th, traders are focused on the Federal Reserve decision at 18:00 UTC, mega cap technology earnings and renewed oil-market volatility.
US500 Market overview
The S&P 500 market analysis picture is mixed but not outright bearish. The index has pulled back from its July highs and is down about 1.07% over five days and 0.94% over one month, while remaining up about 8.52% year to date and 16.61% over one year. That combination points to short-term consolidation inside a broader uptrend.
Although the SP500 is displaying short-term technical pressures, trading below the 50-day moving average, but still well above the 100-day and 200-day averages. For retail traders, this creates a market that may react sharply to news, especially if the Fed or major earnings reports shift expectations for rates, AI spending or profit margins.
Latest market news
On July 28th, most U.S. stocks rose after stronger-than-expected results from companies including Coca-Cola, and Visa but weakness in chip and AI-linked stocks kept the S&P 500 advance modest while the Nasdaq slipped.
The July 29th session is being framed around a Federal Reserve policy decision. Market commentary ahead of the announcement indicates expectations for no immediate rate change, but investors are watching closely for language on inflation, energy prices, tariffs and whether a September rate hike remains possible.
Big Tech earnings remain another key catalyst. Microsoft and Meta are due after the July 29 close, with Apple and Amazon also in focus this week. Because technology and AI-related names carry large index weights, any disappointment around capital spending, margins or forward guidance could have an outsized impact on the SP500 trading outlook.
Geopolitics and oil prices are also relevant. Oil jumped again on July 29th after renewed Middle East tension, reversing part of the easing seen on July 28. Higher energy prices may complicate the inflation outlook and could make the market more sensitive to Fed communication.
S&P 500 technical analysis
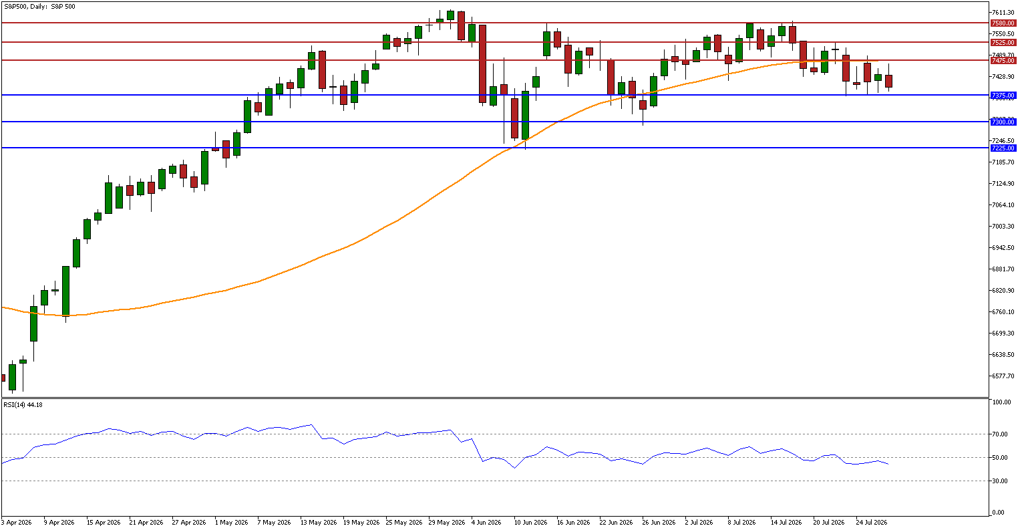
S&P 500 technical analysis shows a short-term market trying to stabilize after slipping below the 50-day moving average.
Momentum is neutral to mildly negative. RSI around 43-44 on the daily timeframe is neutral, which means price may remain choppy unless a catalyst creates a clearer breakout or breakdown.
Near resistance sits around 7,475, where the 50-day also clusters. A stronger recovery may need to clear this area and then the 7,525 zone. Near support sits around 7375, close to recent lows and the lower, and a deeper break would bring 7,300 and 7,225 into focus.
Fundamental and macro drivers
The fundamental backdrop is balanced. Corporate earnings are still providing pockets of support, but the market is increasingly selective. Defensive and non-tech sectors helped offset semiconductor weakness on July 28, suggesting rotation can cushion the S&P 500 if earnings breadth improves.
Rates are the main macro risk. If the Fed holds rates steady but sounds data-dependent rather than aggressively hawkish, equity sentiment may stabilize. If policymakers emphasize inflation risks from energy, tariffs or AI-linked demand, equity valuation pressure could return, especially for growth-heavy sectors.
Oil and geopolitics are a second macro driver. Higher crude prices can raise inflation expectations and weigh on consumer sentiment, but lower yields on risk-off days may partly offset that effect. This tension keeps the S&P 500 price forecast highly catalyst-dependent.
Bullish scenario for the S&P 500
A bullish scenario may gain support if the Fed avoids a hawkish surprise, Microsoft, Meta, Apple and Amazon deliver guidance that reassures investors on AI spending and margins, and oil volatility fades. Under that setup, traders may watch for SP500 to reclaim 7,475 and hold above that zone on a closing basis.
If buyers can sustain a move above the 50-day average, the index could retest 7,525 first and then the 7,580-7,600 resistance band. A constructive backdrop, with gains outside mega cap technology, would make the bullish case more durable.
Bearish scenario for the S&P 500
A bearish scenario may develop if the Fed signals greater concern about inflation, earnings from mega cap technology disappoint, or rising oil prices revive stagflation concerns. In that case, the recent short-term decline may gain momentum and leave sellers in control.
A decisive move below 7,375 would weaken the short-term S&P 500 technical analysis setup. That could expose 7,300, then 7,225 if risk sentiment deteriorates more sharply.
Key levels and catalysts to watch
- Resistance: 7,475, then 7,525, followed by the 7,580-7,600 area.
- Support: 7,375, then 7,300 and the 7,225 June low.
- Catalysts: July 29 Federal Reserve decision and press messaging, Microsoft and Meta earnings, Apple and Amazon earnings later in the week, semiconductor and AI-sector breadth, U.S. Treasury yields, crude oil prices and Middle East headlines.
Conclusion
The S&P 500 (SP500) market analysis outlook is finely balanced. The index remains in a longer-term uptrend, but the short-term chart has softened after a pullback from July highs.
For the next 1-2 weeks, the most important drivers are the Fed's inflation message, Big Tech earnings quality and whether oil-driven macro stress fades or intensifies.

Risk disclaimer: CFDs are complex instruments and come with a high risk of losing money rapidly due to leverage. You should consider whether you understand how CFDs work and whether you can afford to take the high risk of losing your money. Never deposit more than you are prepared to lose. Professional client’s losses can exceed their deposit. Please see our risk warning policy and seek independent professional advice if you do not fully understand. This information is not directed or intended for distribution to or use by residents of certain countries/jurisdictions including, but not limited to, USA & Countries included in the OFAC sanction list. The Company holds the right to alter the aforementioned list of countries at its own discretion.
TIOmarkets offers an exclusively execution-only service. The views expressed are for information purposes only. None of the content provided constitutes any form of investment advice. The comments are made available purely for educational and marketing purposes and do NOT constitute advice or investment recommendation (and should not be considered as such) and do not in any way constitute an invitation to acquire any financial instrument or product. TIOmarkets and its affiliates and consultants are not liable for any damages that may be caused by individual comments or statements by TIOmarkets analysis and assumes no liability with respect to the completeness and correctness of the content presented. The investor is solely responsible for the risk of his/her investment decisions. The analyses and comments presented do not include any consideration of your personal investment objectives, financial circumstances, or needs. The content has not been prepared in accordance with any legal requirements for financial analysis and must, therefore, be viewed by the reader as marketing information. TIOmarkets prohibits duplication or publication without explicit approval.
Join us on social media



Authors BIO

Eleni is a financial markets enthusiast contributing to content covering forex, indices, commodities, and global market developments. She is passionate about researching market-related topics and helping make financial information more accessible to traders.








