


US30 Dow Jones Market Analysis: Fed, Oil in Focus
BY Eleni Antoniou
|July 24, 2026The US30 (Dow Jones), is trading around 51,800 as of the 24th July 2026. The index is still higher year to date, but yesterdays decline left US30 below its recent consolidation zone and put the 52,000 - 53,000. Dow Jones futures has pointed to a tentative stabilization around the 51,500 level, as oil prices eased, but the rebound remains vulnerable while Treasury yields and geopolitical energy risks stay elevated.
Latest US30 Dow Jones market news
The broader U.S. equity sell-off was driven by a combination of mega cap earnings disappointment, concern about AI-related capital spending, higher Treasury yields and a sharp oil move linked to Middle East tensions.
The selling pressure was not isolated to the Dow. The S&P 500 fell 1.2% and the Nasdaq Composite dropped 2.2% on 23 July, showing that risk appetite deteriorated across growth and cyclical areas. Dow-sensitive themes were mixed: defensive and industrial pockets held up better than high-valuation technology, while oil-linked inflation concerns weighed on rate-sensitive sentiment.
Early 24 July commentary pointed to firmer U.S. index futures as Brent and WTI crude retreated from the previous spike. That is supportive for a short-term relief attempt, but traders may treat it as a stabilization signal rather than a confirmed trend reversal until cash-market breadth improves.
US30 Dow Jones technical analysis
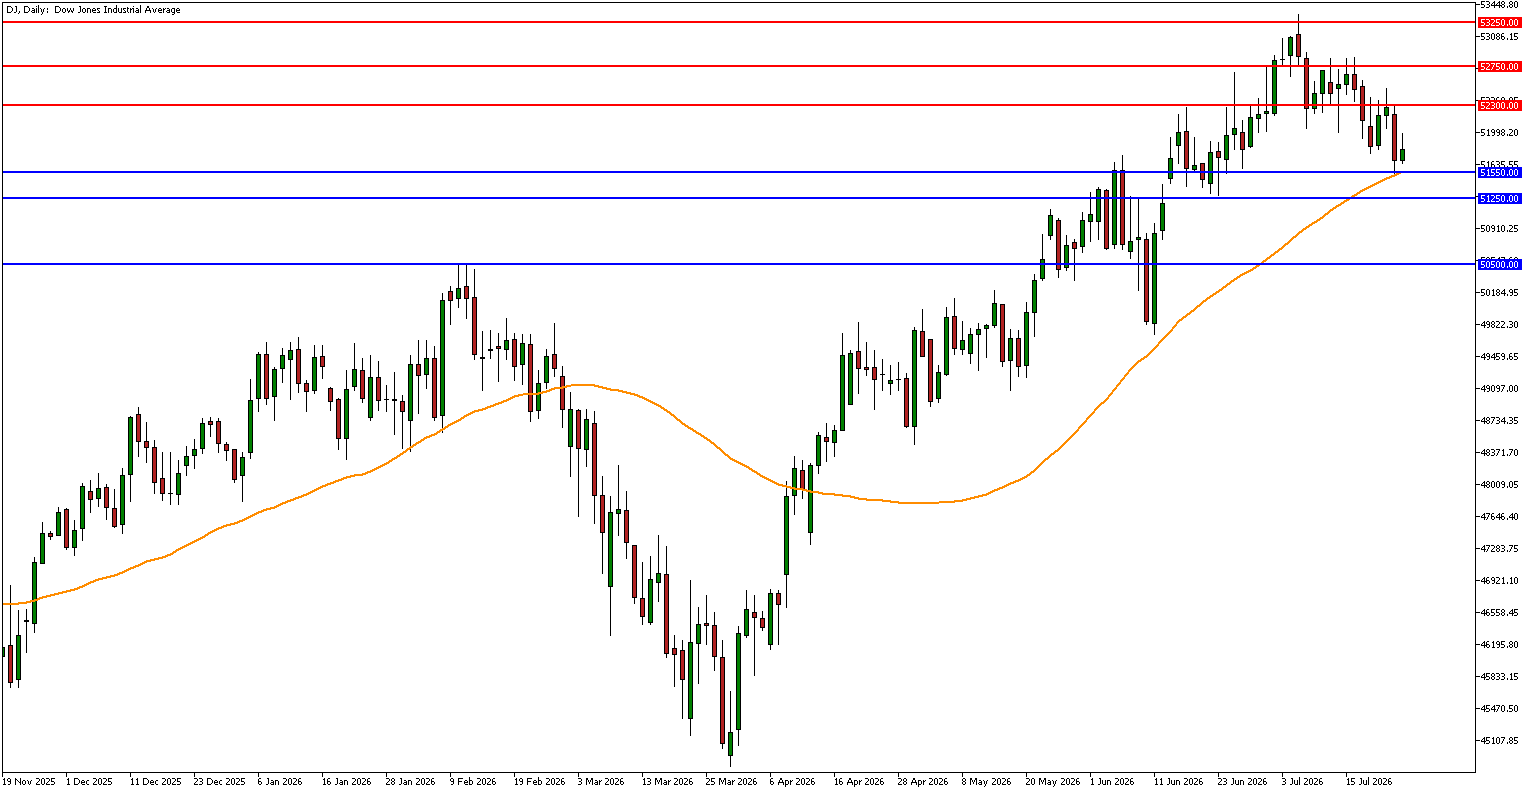
US30 has pulled back from the July 6 closing high of 53,300 and is now testing the lower part of its late-June to July range. The curernt price sits above the approximate 50-day average near 51,560. This setup suggests short-term momentum has cooled, even though the medium-term trend from the March low remains constructive.
Immediate support is around 51,550 area, matching the latest session low/close zone and several June pivot points. A sustained break below this may expose 51,000-50,600, where late-May and early-June consolidation occurred. If risk appetite deteriorates further, 49,900-50,000 becomes the next larger support zone from the June 10 pullback.
Resistance begins around 52,200-52,350, where the index stalled before the 23 July sell-off. Above that, 52,650-52,900 is the next resistance area, followed by the record zone around 53,050. A recovery through 52,650 would signal that buyers are absorbing the oil/yield shock; a failure below 52,200 would keep the market vulnerable to another support test.
Fundamental and macro drivers
The Dow Jones trading outlook is being shaped by three connected drivers: energy prices, Federal Reserve expectations and earnings quality. Higher oil prices can pressure equities through inflation expectations and margin concerns, especially if the move is driven by geopolitical supply risk. A retreat in crude helps sentiment, but renewed spikes would quickly revive inflation concerns.
The Federal Reserve's July Monetary Policy Report described inflation as elevated relative to the 2% objective, while also noting a broadly stable labor market and moderate first-quarter GDP growth. That mix keeps policy uncertainty alive: resilient activity can support corporate earnings, but sticky inflation and high yields can cap equity valuations.
Upcoming catalysts over the next two weeks include durable-goods orders on 27 July, consumer confidence on 28 July, the FOMC decision and press conference on 29 July, and GDP, income, spending and PCE inflation data on 30 July. For US30, these releases matter because the index is sensitive to the balance between cyclical earnings resilience and interest-rate pressure.
US30 bullish scenario
A bullish scenario may gain support if oil remains below its recent spike, Treasury yields retreat and the 51,500-51,700 support zone holds on closing basis. In that case, traders may watch for a recovery above 52,200-52,350 as an early sign that the late-July sell-off is being absorbed.
If US30 can reclaim 52,650, the market could attempt a move back toward 52,900-53,050. A stronger bullish case would need improving market breadth and earnings reactions that show investors are willing to look through AI-capex concerns and focus on revenue growth, margins and industrial resilience.
US30 bearish scenario
A bearish scenario may develop if US30 fails to regain 52,200 and breaks below 51,500 on renewed oil strength, rising yields or a hawkish Fed signal. Under that setup, downside risk may extend toward 51,000-50,600, with 49,900-50,000 acting as a deeper support zone.
The bearish case would also strengthen if upcoming macro data point to sticky inflation without enough growth strength to protect earnings expectations. In that environment, traders may reduce exposure to economically sensitive equities, and US30 could remain under pressure even if defensive Dow components outperform the broader market.
Key levels and catalysts to watch
- Resistance: 52,300, then 52,750, followed by the 53,250 high area.
- Support: 51,550, then 51,250, followed by 50,500
- Catalysts: crude oil volatility, Treasury yields, Fed decision on 29 July, GDP/PCE data on 30 July, and large-cap earnings reactions.
A daily close below 51,500 would weaken the short-term technical picture; a close back above 52,300 would improve recovery perceptions.
Conclusion
US30 remains in a medium-term uptrend, but the short-term Dow Jones market analysis has turned more cautious after yesterdays decline. The next one to two weeks may hinge on whether oil prices and Treasury yields ease enough to let buyers defend 51,500.

Risk disclaimer: CFDs are complex instruments and come with a high risk of losing money rapidly due to leverage. You should consider whether you understand how CFDs work and whether you can afford to take the high risk of losing your money. Never deposit more than you are prepared to lose. Professional client’s losses can exceed their deposit. Please see our risk warning policy and seek independent professional advice if you do not fully understand. This information is not directed or intended for distribution to or use by residents of certain countries/jurisdictions including, but not limited to, USA & Countries included in the OFAC sanction list. The Company holds the right to alter the aforementioned list of countries at its own discretion.
TIOmarkets offers an exclusively execution-only service. The views expressed are for information purposes only. None of the content provided constitutes any form of investment advice. The comments are made available purely for educational and marketing purposes and do NOT constitute advice or investment recommendation (and should not be considered as such) and do not in any way constitute an invitation to acquire any financial instrument or product. TIOmarkets and its affiliates and consultants are not liable for any damages that may be caused by individual comments or statements by TIOmarkets analysis and assumes no liability with respect to the completeness and correctness of the content presented. The investor is solely responsible for the risk of his/her investment decisions. The analyses and comments presented do not include any consideration of your personal investment objectives, financial circumstances, or needs. The content has not been prepared in accordance with any legal requirements for financial analysis and must, therefore, be viewed by the reader as marketing information. TIOmarkets prohibits duplication or publication without explicit approval.
Join us on social media



Authors BIO

Eleni is a financial markets enthusiast contributing to content covering forex, indices, commodities, and global market developments. She is passionate about researching market-related topics and helping make financial information more accessible to traders.








