


Oil Price Analysis: WTI Pares 3-Month High on Oman Corridor Plan
BY Ahmed Osama
|September 9, 2026WTI crude trades in the $91.50 to $94.00 area, near $92.50, after topping $94.24 on Tuesday and then paring the move. The benchmark sits at a three-month high, up roughly 15% over the past month.
Two developments are pulling in opposite directions. Press reports say US forces struck three Iranian oil tankers on Saturday, following Iranian ballistic missile fire directed at two US Navy vessels. Separately, Iran stated on Monday that it would establish a new shipping corridor with Oman through the Strait of Hormuz.
That second item is the one worth reading carefully, and it frames this WTI crude oil analysis. It could ease transit, or it could add a new condition to it.
Key Market Highlights
- USOIL near $92.50, having topped $94.24 on Tuesday before paring gains
- Crude is at a three-month high, up about 15% in a month and roughly 50% year on year
- Iran proposed a new Oman transit corridor on Monday, under which vessels would coordinate with Tehran to enter a restricted maritime zone
- Iran also indicated the arrangement could provide a temporary safe-passage route, while warning that ships remain at risk
- Chinese August crude imports strengthened, with refiners increasing Persian Gulf purchases
- The EIA outlook and OPEC monthly report land today, with the delayed inventory report Thursday
What is Driving WTI Crude Oil Prices This Week?
The move is being set by transit risk rather than by a confirmed change in the physical balance.
Reported events over the weekend and Monday:
- Press coverage indicates US forces struck three Iranian oil tankers on Saturday. The same reporting states that Iran had launched ballistic missiles at two US Navy vessels
- On Monday, Iran stated it would establish a new shipping corridor in coordination with Oman, under which vessels would be required to coordinate with Tehran to enter a newly defined restricted maritime zone around the Strait
- Iran separately indicated that an agreement with Oman could soon provide a temporary safe-passage route, while warning that ships remain at risk
The market reaction was immediate but incomplete. Crude reached $94.24 and then retreated within the same session, which suggests participants have not settled on a single reading.
The Oman corridor: why it cuts both ways
This is the development most coverage is treating as a single-direction story, and the market's own behaviour suggests it is not.
The supportive reading for the oil price: the proposal introduces a coordination requirement that did not previously exist. Any additional condition attached to passage through a waterway carrying a substantial share of seaborne crude adds friction, and friction supports the risk premium.
The bearish reading: a mechanism that restores predictable transit reduces the disruption premium currently embedded in the price. A functioning corridor, even a conditional one, moves more barrels than a contested one.
Neither reading has won yet. Tuesday's spike and same-session reversal is what an unresolved question looks like in price. Until the arrangement produces observable transit volumes, headline sensitivity stays elevated.
What the oil data shows beneath the headlines
Three data points sit under the geopolitical premium, and two of them are not supportive.
Chinese demand has improved. August crude imports strengthened, with refiners increasing purchases from the Persian Gulf and elsewhere. Higher imports have allowed China to export more refined products, providing some relief to global product markets. That reverses the July pattern, when imports fell 24.3% year on year even as they rose 22% against June.
The IEA expects demand to fall. Its August forecast projects global oil demand declining by roughly 1.6 million barrels per day in 2026, partly because sustained high prices erode consumption.
OPEC+ output guidance removes a scheduled increase. Reporting indicates the group is holding October output at September levels, which takes an incremental supply addition off the table. Quotas and actual export flows remain separate questions.
The tension is straightforward. Oil prices are being set by transit risk, while the demand data underneath is mixed at best.
This week's oil data is unusually dense
Four scheduled releases land in three days, each capable of moving the market.
- Today, 9 September: the EIA Short-Term Energy Outlook and the OPEC Monthly Oil Market Report. The EIA's August edition forecast Brent averaging around $85 per barrel in the third quarter, well below current levels, and assumed ongoing disruption of roughly 0.6 million barrels per day continuing through the end of 2027. Today's update shows whether those assumptions have moved toward the market
- Thursday, 10 September: the delayed EIA Weekly Petroleum Status Report, postponed by the US holiday, alongside US producer price data
- Friday, 11 September: US consumer price data and the IEA monthly report
The inventory report matters most for the domestic balance. A sizeable build would expose a gap between the oil price and US fundamentals; a draw would support the current move.
The inflation data matters through a second channel. Higher energy prices feed inflation expectations, which affects the dollar and rate expectations, which in turn affect crude.
USOIL technical analysis: key oil price levels
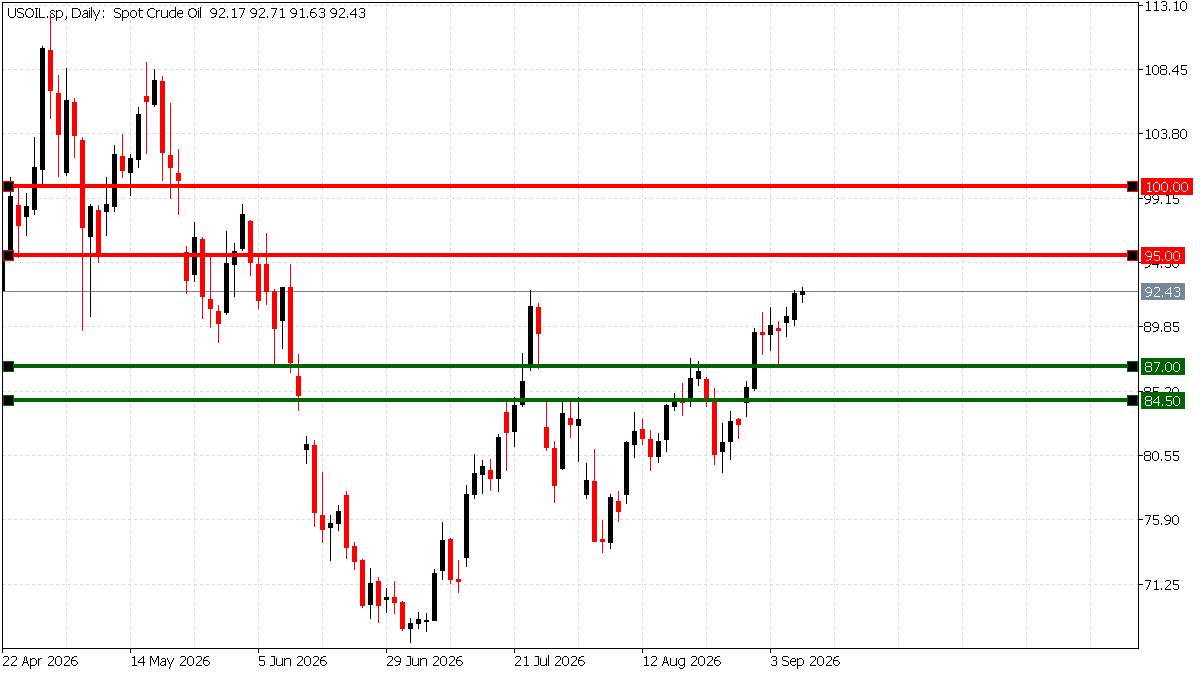
Source: TIOmarkets MT5 live USOIL chart,9 September 2026.
The daily structure has strengthened materially since the late-June trough near $70. WTI held above the mid-$80s through the second half of August, accelerated above $91.50 in early September, and reached $94.24 on Tuesday before retreating.
Resistance levels to watch:
- $94.00 to $95.00: the zone tested and rejected on Tuesday, now the immediate barrier
- $98.50: the next reference, aligning with the spring swing area
- $100.00 to $100.30: the broader objective on a sustained break
Support levels to watch:
- $91.50: the first reference after the early-September breakout, and the level separating consolidation from failure
- $87.00: the mid-August pivot
- $84.50 to $85.00: the prior consolidation zone; a loss here would materially weaken the current structure
The structural read is constructive while price holds above $91.50, with higher lows intact since late June.
But the position is extended. A 15% advance in a month leaves little cushion, and Tuesday's rejection at $94 shows the market is not accepting higher levels without new information. Rejection at resistance after a vertical move is a normal pause rather than a reversal, but it does place the burden on the next data release.
WTI Crude Oil Bullish Scenario: 9-23 September
This bullish WTI crude oil analysis scenario may strengthen if the Oman corridor does not produce observable transit improvement, volumes remain constrained, and Thursday's inventory report shows a draw.
A daily close above $95.00 would reopen $98.50, with $100.00 to $100.30 beyond it.
Supporting factors include further incidents affecting shipping, an EIA outlook that raises its disruption assumptions, continued Chinese buying, or evidence that OPEC+ compliance is tightening actual exports.
Invalidation: a close beneath $91.50 would weaken this scenario, and a break of $87.00 would remove it.
WTI Crude Oil Bearish Scenario: 9-23 September
The bearish case may strengthen if the Oman arrangement produces functioning transit, reducing the risk premium, or if Thursday's report shows a significant inventory build.
A close beneath $91.50 would put $87.00 back in focus, and a break of the $84.50 to $85.00 zone would signal the early-September breakout has failed.
Supporting factors include an EIA outlook that holds its normalisation path, confirmation of the IEA demand forecast, a firmer dollar following the inflation data, or visible improvement in tanker traffic.
Invalidation: a sustained close above $95.00 would challenge this view.
A note on market mechanics. This market is pricing the probability of interruption rather than a measured balance. Prices set that way move on headlines rather than data, and the Oman corridor is precisely the kind of development that can be read either way. Position sizing carries more weight here than in a fundamentally driven market.
Key oil price levels and catalysts to watch
- Resistance: $94.00 to $95.00, then $98.50, then $100.00 to $100.30
- Support: $91.50, then $87.00, then $84.50 to $85.00
- Reference low: around $70 (late June 2026)
- Wednesday 9 September: EIA Short-Term Energy Outlook and OPEC Monthly Oil Market Report
- Thursday 10 September: delayed EIA Weekly Petroleum Status Report and US producer price index
- Friday 11 September: US consumer price index and IEA monthly report
- Ongoing: Strait of Hormuz transit conditions, the Oman corridor proposal, Chinese import data, and the dollar
Conclusion: what this WTI Crude Oil price analysis shows
WTI has reached a three-month high on transit risk, then failed at $94.00 to $95.00 within the same session.
The Oman corridor is the variable to watch. It can be read as adding a condition to passage, which supports the price, or as restoring predictable transit, which does not. Until the market settles on one reading, headline sensitivity stays elevated.
The data underneath is mixed. Chinese imports improved in August, but the IEA still projects demand falling 1.6 million barrels per day this year, and holding OPEC+ output steady does not change actual export flows.
$91.50 is the level that matters now. Holding it keeps the advance intact and $95.00 in play; losing it returns attention to $87.00. With the EIA outlook today, the delayed inventory report Thursday and inflation data Friday, this week supplies more information than any other in the current move.

Risk disclaimer: CFDs are complex instruments and come with a high risk of losing money rapidly due to leverage. You should consider whether you understand how CFDs work and whether you can afford to take the high risk of losing your money. Never deposit more than you are prepared to lose. Professional client’s losses can exceed their deposit. Please see our risk warning policy and seek independent professional advice if you do not fully understand. This information is not directed or intended for distribution to or use by residents of certain countries/jurisdictions including, but not limited to, USA & Countries included in the OFAC sanction list. The Company holds the right to alter the aforementioned list of countries at its own discretion.
TIOmarkets offers an exclusively execution-only service. The views expressed are for information purposes only. None of the content provided constitutes any form of investment advice. The comments are made available purely for educational and marketing purposes and do NOT constitute advice or investment recommendation (and should not be considered as such) and do not in any way constitute an invitation to acquire any financial instrument or product. TIOmarkets and its affiliates and consultants are not liable for any damages that may be caused by individual comments or statements by TIOmarkets analysis and assumes no liability with respect to the completeness and correctness of the content presented. The investor is solely responsible for the risk of his/her investment decisions. The analyses and comments presented do not include any consideration of your personal investment objectives, financial circumstances, or needs. The content has not been prepared in accordance with any legal requirements for financial analysis and must, therefore, be viewed by the reader as marketing information. TIOmarkets prohibits duplication or publication without explicit approval.
Join us on social media



Authors BIO

An experienced financial analyst and educator with over 8 years of expertise covering gold, forex, and global financial markets. Ahmed specializes in blending price action analysis with macroeconomic data to accurately interpret market movements, providing readers with comprehensive educational insights into trading and the financial world.





