


WTI Crude Oil (USOIL) Market Analysis: August 2026
BY Eleni Antoniou
|August 26, 2026WTI crude oil (USOIL) enters the final week of August near $86 per barrel after a sharp rebound from the early-August low near $74.4. The short-term trading outlook is being pulled in two directions: a material geopolitical supply premium centred on Middle East shipping risks, and a demand backdrop that has weakened as high fuel prices weigh on consumption. This analysis uses the near-dated NYMEX WTI benchmark as the working proxy for USOIL and considers the next one to two weeks.
USOIL Market Overview
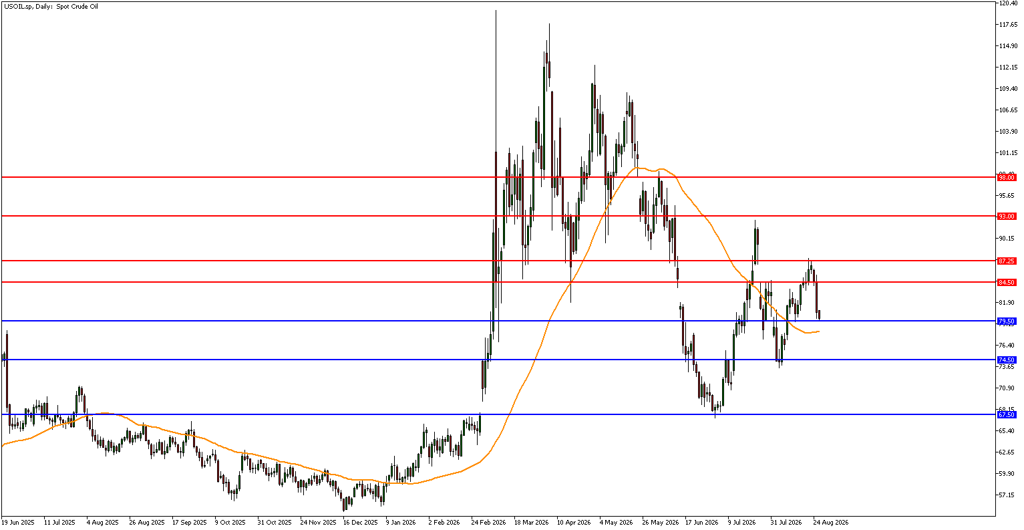
WTI has recovered roughly 15% from the 4 August intraday low around $74.4 and tested the $87.25 area on 20 August before easing. The recovery followed an unusually volatile July, when prices moved through a wide range as developments around the Strait of Hormuz repeatedly changed the market’s assessment of available supply. The latest pullback appears consistent with profit-taking after the advance, rather than a confirmed reversal, but price is now below a nearby resistance band and remains highly sensitive to headlines.
Latest Market News for WTI Oil
Recent reporting indicated that oil prices fell on 24 August as investors assessed prospective additional U.S. sanctions on Iran after two weekly gains. The same reporting noted that the lack of progress in U.S.-Iran talks had kept a cap on shipments through the Strait of Hormuz. Separately, the IEA’s August Oil Market Report described continued maritime disruption, reduced regional exports, depleted observed inventories and a projected global deficit of 1.8 million barrels per day in the third quarter. These factors explain why downside moves can be abrupt but have so far attracted buying interest.
WTI Crude Oil (USOIL) Technical Analysis
The daily sequence shows a recovery from the $74.50 area to around $87.25. The $87.25 area is the first resistance zone; a sustained daily close above it would put the late-July $93 highs back into focus. On the downside, $79.50 is the first short term potential support area. Below that, $74.50 is a more significant retracement zone, while $67.50 marks the base of the early July recovery area and remains the broader swing low. Bearish momentum increased yesterday, 24th August, so the immediate signal is whether buyers can defend $79.50 and $74.50, rather than whether price can simply revisit resistance.
Fundamental and Macro Drivers
Supply risk remains the dominant upside driver. The IEA reported that Gulf production and exports were still materially below pre-disruption levels, and that the route through Hormuz remained impaired. Its assessment also pointed to tighter product markets and very low observed inventory buffers. For the bearish case, the IEA reduced its 2026 demand forecast and expects demand to remain weak through the third quarter before improving later in the year. OPEC+ adds another balancing force: seven participating countries announced a 188,000 barrel-per-day production adjustment for September and scheduled their next meeting for 6 September. The market will weigh the policy increase against the practical ability to restore disrupted barrels.
Bullish Scenario: WTI Price Forecast
A bullish USOIL scenario may gain support if shipping constraints persist or intensify, sanctions remove additional effective supply, or inventory data reinforce the tightening narrative. A recovery through $87.25 on a daily-closing basis would improve the technical picture and could open a retest of $93. Geopolitical headlines can reverse quickly under the current environment.
Bearish Scenario: WTI Price Forecast
A bearish scenario may develop if there is a credible improvement in Hormuz transit, if additional supply reaches the market more quickly than expected, or if weak demand expectations dominate the supply narrative. A daily close below $79.50 could point to a deeper pullback toward $74.50. A decisive break below $74.50 would place $67.50 back in view. This scenario would be strengthened by evidence of rising crude stocks or a material reduction in geopolitical risk.
Key Levels and Catalysts to Watch
- Support: $79.50, $74.50, then $67.50
- Resistance: $87.25, then $93
Catalysts
- U.S. weekly petroleum data, due 26 August, for changes in crude and refined-product stocks.
- Developments affecting Strait of Hormuz transit and any follow-through from Iran-related sanctions.
- OPEC+ communications ahead of the 6 September meeting and evidence of September supply changes.
- Refining margins, fuel demand signals and the tone of broader risk markets and the U.S. dollar.
Conclusion
WTI crude oil still remains in a headline-driven, high-volatility environment. The price structure is constructive above $74.50, but the failed attempt to continue above $87.25 means the market has not yet put in a short-term swing high improving bullish structure. Over the next one to two weeks, traders may watch the balance between shipping disruption, sanctions and inventory signals on one side, and weaker demand expectations plus OPEC+ supply policy on the other.

Risk disclaimer: CFDs are complex instruments and come with a high risk of losing money rapidly due to leverage. You should consider whether you understand how CFDs work and whether you can afford to take the high risk of losing your money. Never deposit more than you are prepared to lose. Professional client’s losses can exceed their deposit. Please see our risk warning policy and seek independent professional advice if you do not fully understand. This information is not directed or intended for distribution to or use by residents of certain countries/jurisdictions including, but not limited to, USA & Countries included in the OFAC sanction list. The Company holds the right to alter the aforementioned list of countries at its own discretion.
TIOmarkets offers an exclusively execution-only service. The views expressed are for information purposes only. None of the content provided constitutes any form of investment advice. The comments are made available purely for educational and marketing purposes and do NOT constitute advice or investment recommendation (and should not be considered as such) and do not in any way constitute an invitation to acquire any financial instrument or product. TIOmarkets and its affiliates and consultants are not liable for any damages that may be caused by individual comments or statements by TIOmarkets analysis and assumes no liability with respect to the completeness and correctness of the content presented. The investor is solely responsible for the risk of his/her investment decisions. The analyses and comments presented do not include any consideration of your personal investment objectives, financial circumstances, or needs. The content has not been prepared in accordance with any legal requirements for financial analysis and must, therefore, be viewed by the reader as marketing information. TIOmarkets prohibits duplication or publication without explicit approval.
Join us on social media



Authors BIO

Eleni is a financial markets enthusiast contributing to content covering forex, indices, commodities, and global market developments. She is passionate about researching market-related topics and helping make financial information more accessible to traders.





