


Gold Slips Below $4,400 as Hike Odds Near 60% Before CPI
BY Ahmed Osama
|September 7, 2026Gold trades in the $4,390 to $4,415 area, near $4,400, extending Friday's decline after a US payrolls report that came in at nearly three times the forecast.
Money markets have repriced sharply. Futures now imply roughly a 58% to 65% probability of a Federal Reserve rate increase at the 15-16 September meeting, depending on the source, up from around 55% before the jobs data.
But the decline is narrower than it looks. The dollar index is trading near two-week lows, which is cushioning the metal. This gold price analysis examines why the two are moving apart, and where the technical structure now sits.
Key Market Highlights
- XAU/USD near $4,400, down roughly 0.8% on the session and about 6% below the late-August high near $4,698
- US payrolls rose 162,000 in August against a forecast of about 56,000, with July revised up from -23,000 to +21,000
- September hike odds now imply roughly 58% to 65%, though published estimates vary by source and methodology
- The dollar index sits near 98.95, close to two-week lows, as yen strength offsets hawkish rate expectations
- Price holds above the 100-day moving average near $4,349 but below both the 20-day mid-line near $4,466 and the 200-day average near $4,536
- US strikes on three Iranian crude tankers on Saturday added to oil-driven inflation concerns
- PPI lands Thursday and CPI on Friday, ahead of the Federal Reserve meeting the following week
What Triggered the Gold Price Decline?
The move began on Friday and has extended into the new week.
The Bureau of Labor Statistics reported August payrolls at 162,000, against a market forecast near 56,000. The unemployment rate held at 4.1%, and July was revised from a loss of 23,000 to a gain of 21,000.
The revision matters as much as the headline, because it removed the evidence that the labour market was contracting, which had been the principal argument for holding rates.
Independent analyst Tai Wong summarised the market reading: "Gold stumbles badly as a huge headline print, and an overall strong report, makes a September rate hike much more likely unless we get a weak CPI report."
The repricing was immediate. Short-term interest-rate futures moved from around 55% before the release to roughly 65% after, per Reuters, while the CME FedWatch tool showed closer to 58%. The direction is unambiguous; the precise level varies by source.
Why the Gold Selloff Remains Contained
This is the detail most coverage is missing, and it explains why gold has not broken further.
Gold is falling on rates, not on the dollar.
The US dollar index trades near 98.95, down about 0.2% on the day and hovering near two-week lows. Ordinarily, a hawkish repricing of that size would lift the dollar and compound the pressure on bullion.
The offsetting force is the yen. USD/JPY trades near 154.50, down roughly 3.3% since the start of the month and back at levels last seen in February. Because the yen carries significant weight in the dollar index, that strength is dragging the index lower even as US rate expectations rise.
The practical implication: one of the two usual headwinds for gold is absent. If the dollar were rising alongside yields, the decline would likely have been deeper.
Middle East Escalation: Geopolitical Impact on Gold
Tensions rose over the weekend after the US military said it struck three Iranian crude oil tankers on Saturday, stating the action followed Iranian ballistic missile fire directed at two US Navy vessels.
The market effect runs through oil rather than through safe-haven demand. Higher crude prices feed into inflation expectations, which reinforces rather than undermines the case for tighter policy.
That is an unusual configuration for gold. Geopolitical escalation normally supports the metal through defensive flows. Here it is arriving through the inflation channel, which works against it.
XAU/USD technical analysis
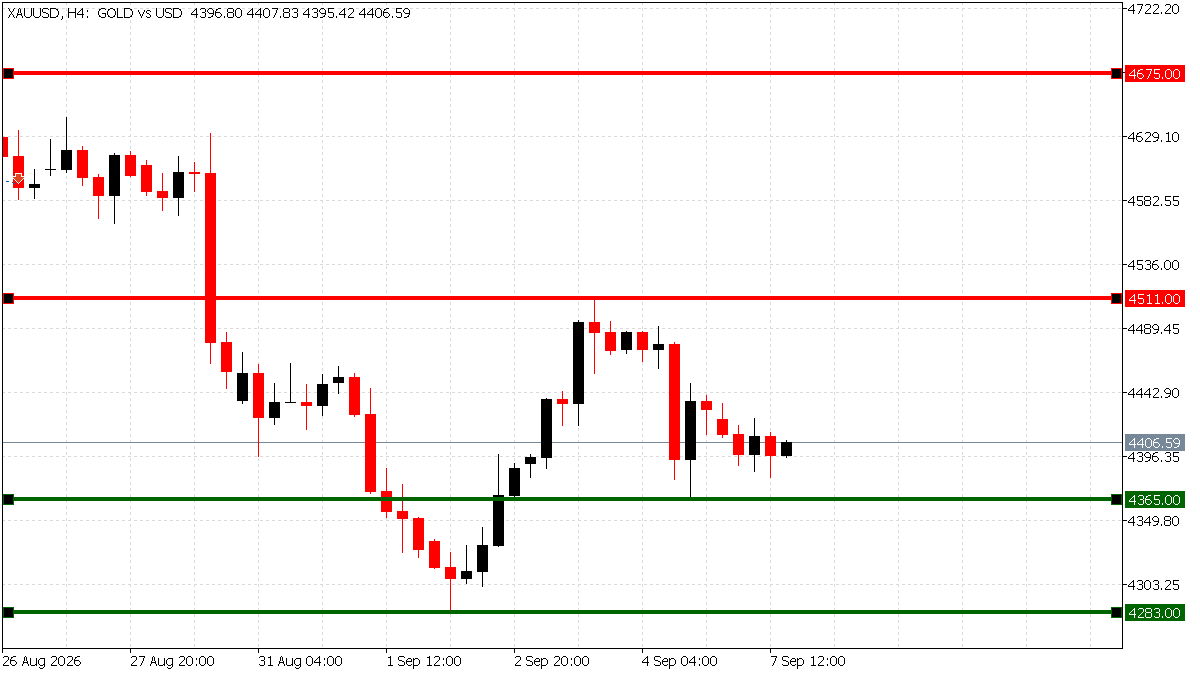
Source: TIOmarkets MT5 live XAU/USD chart
Gold reached $4,697.66 on 25 August, then retreated. It briefly cleared $4,500 on Thursday on dovish Federal Reserve commentary before Friday's payrolls reversed the move.
The structure is now mixed rather than uniformly weak.
Resistance levels to watch:
- $4,411: the immediate intraday reference
- $4,466: the 20-day mid-line, which price lost during the decline
- $4,490 to $4,511: the early-September pivot zone and the 3 September lower high
- $4,536: the 200-day moving average, the more significant structural barrier
- $4,675 to $4,698: the upper band and the late-August high
Support levels to watch:
- $4,365: the 4 September intraday low
- $4,318 to $4,349: a genuine confluence zone, containing the 100-day moving average, the 200-day exponential average and the 50% retracement of the prior advance
- $4,283: the 2 September low
- $4,258: the lower band
Two observations define the current picture.
First, the confluence zone matters more than any single level. The clustering of three independent technical references between $4,318 and $4,349 makes that band the meaningful floor, rather than the round $4,300 figure.
Second, momentum has normalised rather than broken. The 14-day Relative Strength Index sits near 51, having unwound the overbought readings of late August. That is neutral, and it means the market has room to move in either direction without an extreme reading resisting it.
The read: price below the 20-day mid-line and the 200-day average keeps the near-term bias defensive, but holding above the 100-day average means the pullback is not yet disorderly.
Gold Bullish Scenario: 7–18 September
This bullish scenario may strengthen if Friday's inflation data comes in softer than expected, reducing the pressure the payrolls report created.
A recovery above $4,466 would reclaim the 20-day mid-line, with $4,490 to $4,511 the next reference and the $4,536 average beyond it.
Supporting factors include continued dollar weakness, a retreat in Treasury yields, softer PPI on Thursday, or Federal Reserve communication after the meeting that does not validate a further increase.
Invalidation: a daily close beneath $4,365 would weaken this scenario, and a break of the $4,318 to $4,349 confluence would remove it.
Gold Bearish Scenario: 7–18 September
The bearish case may strengthen if PPI or CPI surprise to the upside, pushing hike odds higher and lifting real yields.
A sustained break beneath $4,365 would expose the $4,318 to $4,349 confluence zone. A close beneath that band would put $4,283 and then $4,258 in focus.
Supporting factors include a dollar rebound if yen strength fades, further oil-driven inflation pressure, or additional evidence that the labour market can absorb tighter policy.
Invalidation: a reclaim of $4,466 and a hold above it would challenge this view.
A note on market mechanics. Gold is currently priced on a rate expectation that two data releases can overturn within four days. Positioning built on a single macro assumption tends to unwind quickly when that assumption is tested, which makes Thursday and Friday more consequential than the technical levels themselves.
Navigate Gold Volatility Ahead of US CPI
Monitor live XAU/USD spreads and test your strategy against key support and resistance levels. Trade gold CFDs on MT4 and MT5 with fast execution and transparent pricing.
Trading is risky
Key XAU/USD Levels and Upcoming Macro Catalysts
| Item | Detail |
| Resistance | $4,411, then $4,466, then $4,490 to $4,511, then $4,536 |
| Support | $4,365, then $4,318 to $4,349, then $4,283, then $4,258 |
| Reference high | $4,697.66 (25 August 2026) |
| Tuesday 8 September | US weekly employment data |
| Thursday 10 September | US producer price index and jobless claims |
| Friday 11 September | US consumer price index and preliminary consumer sentiment |
| 15-16 September | Federal Reserve policy meeting and updated projections |
| Ongoing | Treasury yields, the dollar index, oil prices, Middle East developments |
Conclusion
Gold has slipped beneath $4,400 because a payrolls report at nearly three times consensus moved September rate expectations toward 60%, and a non-yielding asset loses ground when the cost of holding it rises.
But the decline has been cushioned. The dollar index sits near two-week lows on yen strength, removing one of the two forces that normally compound a rate-driven selloff in bullion.
The $4,318 to $4,349 band is the level that matters. It combines three independent technical references and has not been tested. Holding it keeps the correction contained; losing it would open the early-September lows.
Thursday and Friday decide it. With PPI and CPI arriving before the Federal Reserve meets, the inflation data now carries more weight than the labour market that created this move.

Risk disclaimer: CFDs are complex instruments and come with a high risk of losing money rapidly due to leverage. You should consider whether you understand how CFDs work and whether you can afford to take the high risk of losing your money. Never deposit more than you are prepared to lose. Professional client’s losses can exceed their deposit. Please see our risk warning policy and seek independent professional advice if you do not fully understand. This information is not directed or intended for distribution to or use by residents of certain countries/jurisdictions including, but not limited to, USA & Countries included in the OFAC sanction list. The Company holds the right to alter the aforementioned list of countries at its own discretion.
TIOmarkets offers an exclusively execution-only service. The views expressed are for information purposes only. None of the content provided constitutes any form of investment advice. The comments are made available purely for educational and marketing purposes and do NOT constitute advice or investment recommendation (and should not be considered as such) and do not in any way constitute an invitation to acquire any financial instrument or product. TIOmarkets and its affiliates and consultants are not liable for any damages that may be caused by individual comments or statements by TIOmarkets analysis and assumes no liability with respect to the completeness and correctness of the content presented. The investor is solely responsible for the risk of his/her investment decisions. The analyses and comments presented do not include any consideration of your personal investment objectives, financial circumstances, or needs. The content has not been prepared in accordance with any legal requirements for financial analysis and must, therefore, be viewed by the reader as marketing information. TIOmarkets prohibits duplication or publication without explicit approval.
Join us on social media



Authors BIO

An experienced financial analyst and educator with over 8 years of expertise covering gold, forex, and global financial markets. Ahmed specializes in blending price action analysis with macroeconomic data to accurately interpret market movements, providing readers with comprehensive educational insights into trading and the financial world.








