


Gold Sinks Below $4,300 as Markets Brace for the Fed
BY Ahmed Osama
|September 15, 2026Gold trades in the $4,240 to $4,320 area, having broken beneath $4,300 and touched its lowest level since 7 August.
The Federal Reserve is expected to raise rates on Wednesday, and markets price that at above 90%. But the inflation prompting the move is substantially an energy story: WTI crude cleared $100 for the first time since late May after further escalation around the Strait of Hormuz.
Interest rates do not produce oil. A higher policy rate cools demand across an economy; it does nothing to resolve a supply constraint in a shipping lane. That tension sits at the centre of Wednesday's decision.
What actually moved gold this week was the bond market. The US 10-year Treasury yield cleared 5% on Monday for the first time since 2023, raising the cost of holding a non-yielding metal to its highest in three years.
This gold price analysis covers the break, the levels that now matter, and why the guidance will be more informative than the rate.
Gold Market Highlights
- XAU/USD in the $4,240 to $4,320 area, after touching its lowest since 7 August
- The 10-year Treasury yield passed 5% on Monday, its first time above that level since 2023
- The 2-year yield reached 4.59%, the highest since July 2024, per Deutsche Bank
- CME FedWatch showed a 92.4% probability of a quarter-point increase, up from 59.4% a week earlier
- WTI crude cleared $100 for the first time since late May, adding to inflation pressure
- August core CPI rose 0.3% monthly, its fastest pace in four months
- The Fed decision, projections and press conference land Wednesday 16 September
What broke the gold price this week
Three forces arrived together, and they reinforced one another.
Yields moved first and moved most. Per Deutsche Bank, the 2-year Treasury yield rose 15.5 basis points to 4.59%, its highest since July 2024, while the 10-year added 12.2 basis points to 4.96% before clearing 5% on Monday. That 5% threshold had not been seen since 2023.
Inflation data supplied the reason. August headline CPI rose 0.4% month on month, accelerating from 0.1% in July, and core CPI rose 0.3%, up from 0.2% and the fastest in four months. Producer prices also came in above the 5.3% expected.
Energy amplified it. WTI crude pushed above $100 for the first time since late May after further escalation around the Strait of Hormuz, where reporting indicates US forces struck three Iran-linked tankers and Iranian forces subsequently targeted three US-affiliated vessels and three oil tankers attempting transit.
The combined effect on rate expectations was dramatic. CME FedWatch probability of a September increase moved from 59.4% a week ago to 70% after the producer price data to 92.4% by Tuesday.
The tension inside the Fed's decision
This is the part most previews are not addressing, and it matters for how tomorrow's guidance should be read.
The inflation the Fed is responding to is substantially energy-driven. Crude above $100 feeds directly into headline prices, and August's acceleration reflects that.
But interest rates do not produce oil. A higher policy rate cools demand across the economy; it does nothing to resolve a supply constraint in a shipping lane.
Two readings follow, and they point in different directions:
- The hawkish case: even supply-driven inflation must be contained before it feeds into expectations and wages, which is where policy does work
- The cautious case: tightening into an energy shock risks slowing an economy for a price rise that policy cannot address at source
Which view dominates the statement and press conference is more informative than the rate itself, which markets have already priced at above 90%.
Note also that core CPI accelerated to 0.3%, which weakens the purely energy-driven reading. Core strips out energy, so its acceleration suggests pressure beyond the oil channel.
XAU/USD technical analysis
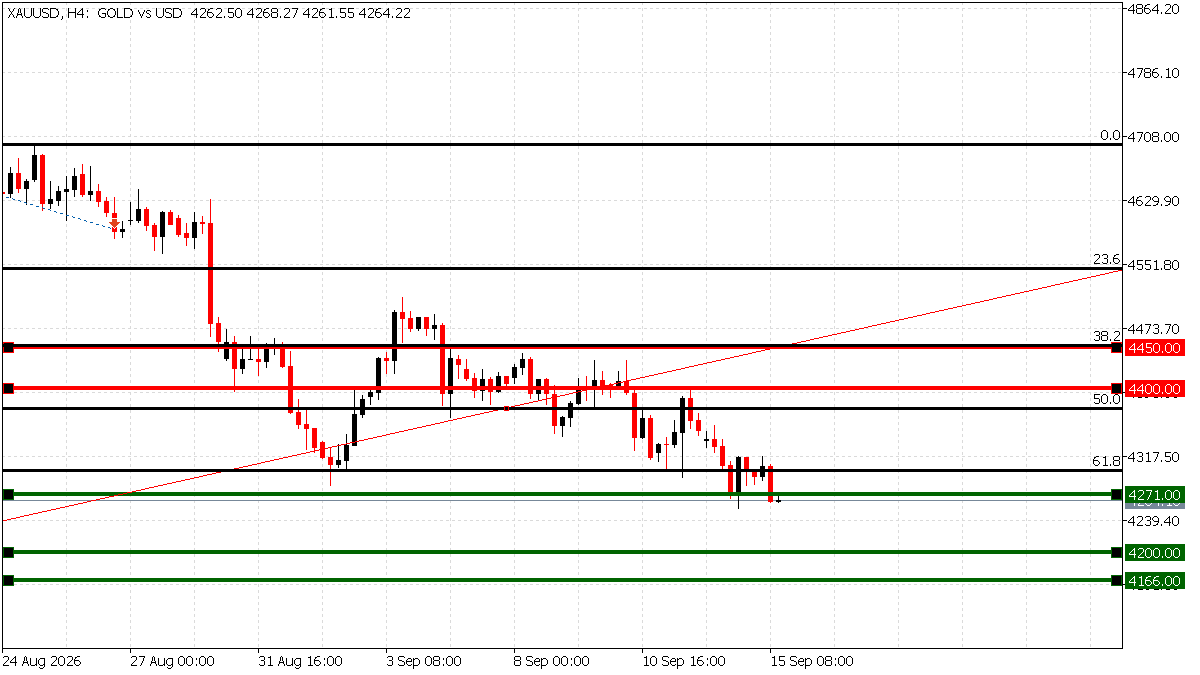
Source: TIOmarkets MT5 live XAU/USD chart,15 September 2026.
Gold has broken structure rather than merely retreated within a range.
Price has moved beneath the 61.8% Fibonacci retracement near $4,292, which had acted as the immediate pivot, and has tested the 50-day moving average near $4,271. The intraday low near $4,278 on Monday was the weakest since 7 August.
Resistance levels to watch:
- $4,292: the 61.8% retracement, now resistance rather than support
- $4,331: the 100-day moving average, the first structural barrier
- $4,400: the round-number level lost during the decline
- $4,435 to $4,450: the band that capped the early-September recovery
Support levels to watch:
- $4,271: the 50-day moving average, the level currently being tested
- $4,200: the psychological reference beneath it
- $4,166: the July high, cited as the next meaningful technical reference
The structural read is heavy. Price sits beneath the 61.8% retracement, beneath the 100-day average, and well beneath the 200-day average. Each of those was a support level a fortnight ago.
But one qualification matters. Gold has fallen into a Federal Reserve decision, not away from one. Markets that decline into a binary event are often positioned rather than valued, and positioning can reverse quickly when the event resolves.
Strategists at OCBC note that gold's earlier rebound had coincided with yields easing from near-5% highs and oil retreating from its peaks. They retain a constructive medium-term bias while describing the coming meeting as the key test of whether a recovery can extend.
Trade Gold (XAU/USD) with TIOmarkets
Navigate the upcoming market volatility surrounding the Fed rate decision and crude oil dynamics. Access tight spreads and fast execution on Gold, Indices, and FX pairs via MT4 and MT5.
Trading is risky
Gold price forecast for the days ahead: bullish scenario
Any gold price forecast for the days ahead now depends almost entirely on Wednesday's outcome and guidance.
This bullish scenario may strengthen if the Federal Reserve raises rates but signals that this completes the adjustment, prompting yields to retreat from 5%.
Because the decision is priced above 90%, the reaction would come from the projections and press conference rather than the rate.
A recovery above $4,292 would reclaim the retracement level, with $4,331 the next reference and $4,400 beyond it.
Supporting factors include a pullback in the 10-year yield, easing crude prices, updated projections showing limited further tightening, or renewed safe-haven demand should escalation intensify.
Invalidation: a daily close beneath $4,271 would weaken this scenario, and a break of $4,200 would remove it.
Gold price forecast for the days ahead: bearish scenario
This bearish scenario may strengthen if the Federal Reserve's projections point to further increases, pushing the 10-year yield further above 5%.
A sustained break beneath $4,271 would expose $4,200, with $4,166 the deeper reference.
Supporting factors include continued yield expansion, crude holding above $100, further upward revisions to the Fed's rate path, or dollar strength extending.
Invalidation: a reclaim of $4,331 and a hold above it would challenge this view.
A note on market mechanics. Gold is priced against expected real yields, which means tomorrow's release moves it through two channels simultaneously: the rate decision and the inflation outlook that accompanies it. Those channels can conflict. A hike paired with lower inflation projections, for instance, could lift gold rather than pressure it, because real yields would fall even as nominal rates rise.
Key gold price levels and catalysts
- Resistance: $4,292, then $4,331, then $4,400, then $4,435 to $4,450
- Support: $4,271, then $4,200, then $4,166
- Reference: the intraday low near $4,278 was the lowest since 7 August
- Today, 15 September: weekly employment data and the New York Empire State manufacturing survey
- Wednesday 16 September: Federal Reserve decision, updated projections and press conference
- Thursday 17 September: initial jobless claims and the Philadelphia Fed manufacturing survey
- Friday 18 September: August industrial production
- Ongoing: the 10-year Treasury yield, crude prices, and Strait of Hormuz developments
Conclusion
Gold has broken beneath $4,300 to its lowest since early August, and the cause sits in the bond market rather than the gold market.
A 10-year yield above 5% raises the opportunity cost of holding a non-yielding asset to its highest in three years. That is a mechanical relationship, and it explains most of the decline without reference to gold's own fundamentals.
The Federal Reserve decision is priced at above 90%, which means the reaction will come from the projections and the press conference. The tension worth watching is that the inflation prompting the response is partly energy-driven, and rate policy does not address supply constraints, though August's core acceleration complicates that reading.
$4,271 is the level that matters now. Holding it keeps a recovery toward $4,292 and $4,331 in play; losing it opens $4,200 and then $4,166.

FAQ
Risk disclaimer: CFDs are complex instruments and come with a high risk of losing money rapidly due to leverage. You should consider whether you understand how CFDs work and whether you can afford to take the high risk of losing your money. Never deposit more than you are prepared to lose. Professional client’s losses can exceed their deposit. Please see our risk warning policy and seek independent professional advice if you do not fully understand. This information is not directed or intended for distribution to or use by residents of certain countries/jurisdictions including, but not limited to, USA & Countries included in the OFAC sanction list. The Company holds the right to alter the aforementioned list of countries at its own discretion.
TIOmarkets offers an exclusively execution-only service. The views expressed are for information purposes only. None of the content provided constitutes any form of investment advice. The comments are made available purely for educational and marketing purposes and do NOT constitute advice or investment recommendation (and should not be considered as such) and do not in any way constitute an invitation to acquire any financial instrument or product. TIOmarkets and its affiliates and consultants are not liable for any damages that may be caused by individual comments or statements by TIOmarkets analysis and assumes no liability with respect to the completeness and correctness of the content presented. The investor is solely responsible for the risk of his/her investment decisions. The analyses and comments presented do not include any consideration of your personal investment objectives, financial circumstances, or needs. The content has not been prepared in accordance with any legal requirements for financial analysis and must, therefore, be viewed by the reader as marketing information. TIOmarkets prohibits duplication or publication without explicit approval.
Join us on social media



Authors BIO

An experienced financial analyst and educator with over 8 years of expertise covering gold, forex, and global financial markets. Ahmed specializes in blending price action analysis with macroeconomic data to accurately interpret market movements, providing readers with comprehensive educational insights into trading and the financial world.





