


S&P 500 Market Analysis: Record Rally Faces CPI
BY Eleni Antoniou
|August 12, 2026The S&P 500 (SP500) is trading near record all-time-highs, but with a demanding test from inflation data, Treasury yields and renewed energy-price risk.
S&P 500 Market overview
The S&P 500 closed at 7,728.98 yesterday, on August 11, down 0.3% for the session but still only about 0.4% below the August 5 record high of 7,791.83. The index has gained approximately 4.2% since July 27 and about 12.7% since the start of 2026. That combination leaves the short-term trend bullish while also increasing sensitivity to any disappointment in inflation, earnings guidance or geopolitical news.
The rally has been powered by strong second-quarter corporate profits, renewed enthusiasm around artificial-intelligence infrastructure and a sharp rebound from the late-July sell-off. The counterweight is a difficult macro mix, including high oil prices keeping inflation elevated, long-term Treasury yields remain restrictive, and a weaker employment signal raises questions about the durability of US growth.
Latest S&P 500 market news
Associated Press reporting on August 6 that roughly 85% of S&P 500 companies had reported aggregate earnings growth, the strongest since 2021. FactSet data cited in early-August that a large share of the profit acceleration was concentrated in major technology and platform companies, so index-level strength does not necessarily imply equally broad earnings momentum.
Geopolitics remains the other immediate volatility channel. Oil prices have moved sharply with news around US-Iran hostilities and the Strait of Hormuz. A sustained disruption to shipping would raise fuel and transport costs, complicate the inflation outlook and potentially lift bond yields. Conversely, credible de-escalation could remove part of the inflation premium and support risk appetite.
July CPI was scheduled for 12:30 UTC today, August 12, after this report snapshot. The pre-release consensus expected annual headline inflation to ease to about 3.4% from 3.5% in June. The actual data released was as expected.
S&P 500 technical analysis
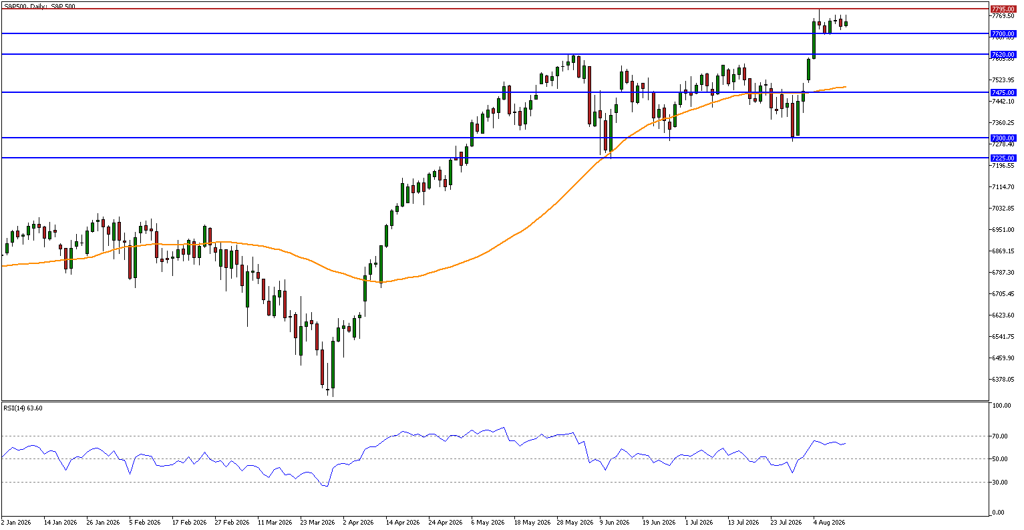
The daily chart shows a decisive recovery from the July 29 low at around 7,300. The SP500 later accelerated through the previous record high at 7,620 and reached a new record at 7,791.83. Price remains above the calculated 50-day moving average, which supports the broader upward structure. Momentum has cooled over recent sessions, however, repeated closes and a tight consolidation area is forming close to the record high, which is the closest active resistance.
Immediate support sits around 7,700, where several recent daily closes clustered. Below it, 7,620 is the first breakout-retest area, followed by the 50-day moving average and the 7,475 region. Immediate resistance is 7,7795. A break-out above it would place the index in price discovery. While failure back below 7,700 would raise the risk that the record-high push is becoming a short-term impulse.
S&P 500 bullish scenario: next 1-2 weeks
A bullish scenario may gain support if inflation data is not hotter than expected, Treasury yields remain contained and oil prices stabilise. A daily close above the 7,795 resistance band would indicate renewed bullish momentum. Under those conditions, traders may watch 7,850 as the first price-discovery psychological reference, followed by the big figure number at 7,900.
The bullish case would be weakened by a quick rejection below 7,700. A more durable invalidation would occur if SP500 loses 7,620 - 7,600 on a closing basis and cannot promptly recover, because that would bring the rising 50-day moving average and 7,475 support back into focus.
S&P 500 bearish scenario: next 1-2 weeks
A bearish scenario may develop if inflation surprises to the upside, producer prices or retail sales push bond yields higher, or an energy shock intensifies. Failure to hold 7,700 would expose 7,620 - 7,600. A close below 7,600 would signal that the early-August breakout is losing traction and could potentially draw the index lower to correct recent gains.
If selling extends through 7,475, the July 29 close near 7,300 becomes the next downside references. The bearish case would be invalidated while price maintains its bullish structure of higher higher and higher lows.
Key levels and catalysts to watch
- Support: 7,700, 7,620 - 7,600, 7,475, 7,300 then 7225.
- Resistance: 7,795, 7,850, then 7,900.
Catalysts to watch
- August 13: July Producer Price Index.
- August 14: July retail sales and preliminary University of Michigan sentiment.
- Oil and Strait of Hormuz headlines, plus movements in two-year and ten-year Treasury yields.
- Remaining second-quarter earnings, forward guidance and market breadth.
Conclusion
The SP500 remains technically constructive because the index is holding near record highs, with a high and tight price pattern, and above its rising 50-day moving average. The next one-to-two weeks are nevertheless event-heavy, and the combination of inflation data, oil volatility, yields and late-season earnings can produce volatility in both directions. These market commentary is intended for your educational purposes only.

Risk disclaimer: CFDs are complex instruments and come with a high risk of losing money rapidly due to leverage. You should consider whether you understand how CFDs work and whether you can afford to take the high risk of losing your money. Never deposit more than you are prepared to lose. Professional client’s losses can exceed their deposit. Please see our risk warning policy and seek independent professional advice if you do not fully understand. This information is not directed or intended for distribution to or use by residents of certain countries/jurisdictions including, but not limited to, USA & Countries included in the OFAC sanction list. The Company holds the right to alter the aforementioned list of countries at its own discretion.
TIOmarkets offers an exclusively execution-only service. The views expressed are for information purposes only. None of the content provided constitutes any form of investment advice. The comments are made available purely for educational and marketing purposes and do NOT constitute advice or investment recommendation (and should not be considered as such) and do not in any way constitute an invitation to acquire any financial instrument or product. TIOmarkets and its affiliates and consultants are not liable for any damages that may be caused by individual comments or statements by TIOmarkets analysis and assumes no liability with respect to the completeness and correctness of the content presented. The investor is solely responsible for the risk of his/her investment decisions. The analyses and comments presented do not include any consideration of your personal investment objectives, financial circumstances, or needs. The content has not been prepared in accordance with any legal requirements for financial analysis and must, therefore, be viewed by the reader as marketing information. TIOmarkets prohibits duplication or publication without explicit approval.
Join us on social media



Authors BIO

Eleni is a financial markets enthusiast contributing to content covering forex, indices, commodities, and global market developments. She is passionate about researching market-related topics and helping make financial information more accessible to traders.








