


S&P 500 (SP500) Market Analysis
BY Panagiotis Philippou
|July 22, 2026The S&P 500 index has moved back toward the 7,500 area after a short pullback, leaving traders to weigh a renewed AI-led technology rebound against higher oil prices, inflation sensitivity, and a busy earnings calendar.
S&P 500 Market Overview
The S&P 500 closed at around 7,515 on 21 July, up 65.92 points, or 0.89%, after snapping a three-session losing streak. The rebound was led by technology and semiconductor companies, with AI-linked shares regaining some ground after a July sell-off in parts of the chip complex.
That bounce keeps the SP500 near an important short-term zone around 7,500. However, the broader market is not trading in a vacuum. Oil has jumped back above the high-$80s to low-$90s area amid renewed U.S.-Iran tensions, raising the risk that energy-led inflation concerns could push Treasury yields higher and make equity valuations harder to justify.
In short, the index is trying to stabilize after a quick technical scare, but confirmation may depend on whether mega cap earnings can support AI spending expectations while bond and oil markets remain contained.
Latest S&P 500 Market News
Recent market reports show the S&P 500 and Nasdaq recovering on 21 July as chip stocks rebounded. Micron, Nvidia and other AI-related names helped restore risk appetite, while the Dow also advanced strongly. The move followed several sessions of softer equity performance as traders questioned whether the AI trade had become crowded.
For 22 July, U.S. index futures pointed lower before the open. Market attention is concentrated on Alphabet and Tesla earnings after the close, with IBM and Texas Instruments also due to report. These results matter for SP500 sentiment because they can influence views on advertising demand, AI capital expenditure, cloud growth, electric-vehicle demand and broader technology leadership.
Macro conditions are also moving back into focus. Oil prices rose sharply as geopolitical tensions intensified, prompting renewed concern that energy costs could complicate the inflation outlook. The economic calendar is relatively light until later this week, but initial jobless claims, S&P Global flash PMIs and new home sales are due before the next Federal Reserve decision window on 28-29 July.
S&P 500 Technical Analysis
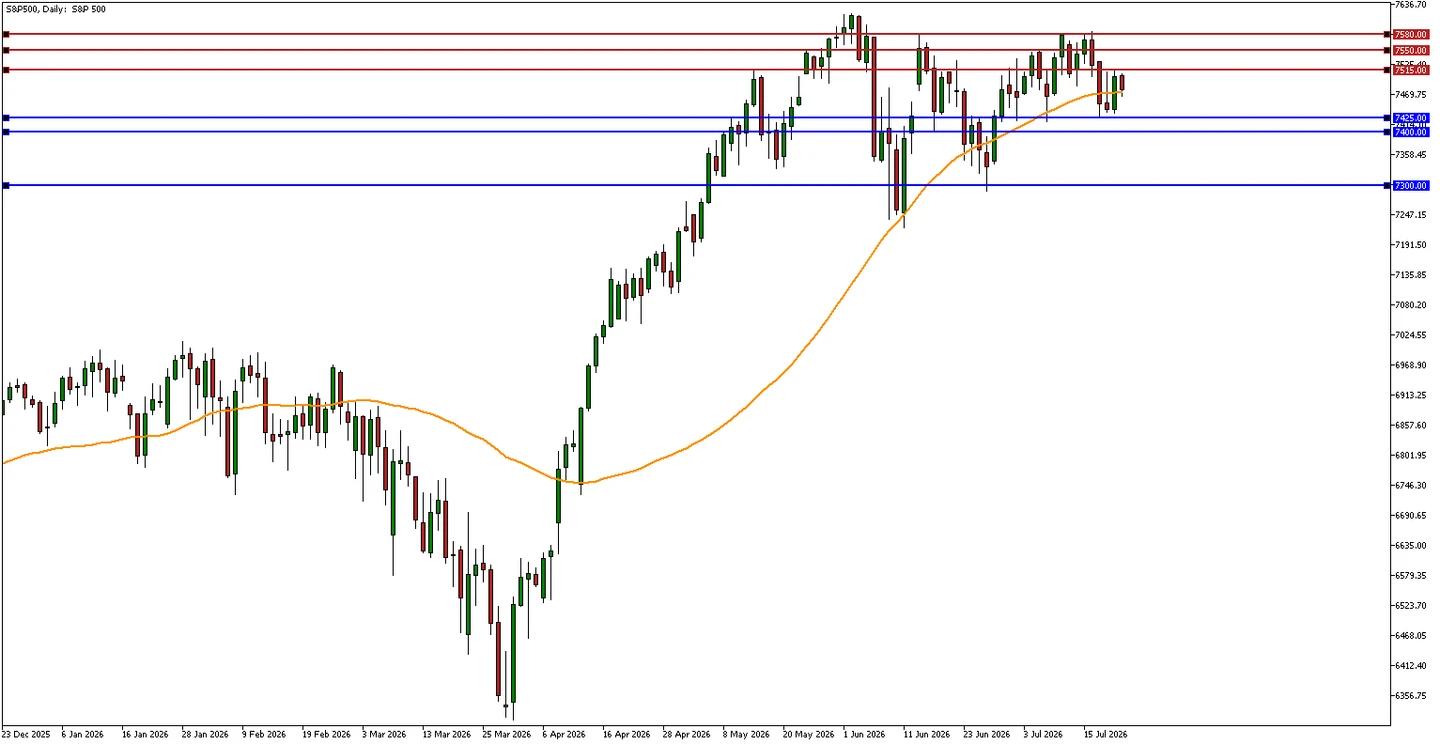
The technical picture is balanced rather than one-directional. The S&P 500 rebounded from the 7,431-7,443 region and reclaimed the 7,500 area at Tuesday's close. That is constructive for short-term momentum, especially after the index briefly traded around or below widely watched 50-day moving-average references.
The 50-day moving average sits roughly around 7,473. This makes this area a practical near-term pivot: holding above it would suggest buyers are defending the trend, while a sustained break back below it could signal that the rebound is losing momentum.
Immediate resistance sits near 7,515, the 21 July intraday high. Above that, traders may watch 7,545-7,580, a cluster of recent July highs. The wider upside reference remains the 52-week high near 7,621. On the downside, initial support is around 7,470, followed by 7,431-7,422. A deeper break could bring the 7,400 area and then the widely discussed 7,200 risk-control zone into focus.
Fundamental and Macro Drivers
Earnings remain the central short-term fundamental driver. Alphabet's results may shape expectations for digital advertising, cloud revenue and AI spending. Tesla's report may influence appetite for high-valuation growth stocks, particularly if investors focus on margins, EV demand, autonomous technology or robotics commentary. Intel, American Express, Verizon and other large companies later in the week can add cross-sector signals.
The Federal Reserve is the second major driver. Recent softer inflation readings had reduced near-term rate-hike expectations, but the renewed rise in crude oil has revived concerns that inflation pressure could reappear. The next FOMC decision and press conference are scheduled for late July, and equity traders may be sensitive to any shift in language on inflation, labor-market resilience or financial conditions.
Market breadth also deserves attention. The SP500 has been heavily influenced by AI-linked technology leadership. A healthier bullish trend would likely require participation beyond a small group of mega cap and semiconductor shares. If defensive sectors lag while cyclicals, technology and communication services recover together, the index would have a better chance of extending the rebound.
Bullish Scenario: SP500 Price Forecast
A bullish S&P 500 scenario may gain support if the index holds above the 7,470-7,500 pivot and earnings from Alphabet, Tesla and other large companies reinforce confidence in revenue growth, AI investment and consumer demand. A move through 7,515 would be the first constructive signal, while sustained trade above 7,545-7,580 could reopen a test of the 7,621 52-week high.
This upside case would be stronger if oil prices stop rising, Treasury yields stabilize and the Fed meeting does not deliver a hawkish surprise. In that environment, short-term dips could continue to attract buyers, and the SP500 trading outlook would shift back toward a retest of record-area resistance.
Bearish Scenario: SP500 Price Forecast
A bearish scenario may build if the S&P 500 fails to hold the 7,470-7,500 region and breaks back below 7,431-7,422. That would suggest the latest rebound was more of a relief bounce than a durable trend recovery. Under that setup, traders may watch whether selling pressure broadens from semiconductors and high-growth technology into the wider index.
Downside risk would also increase if oil continues to climb, Treasury yields rise, earnings guidance disappoints or the Fed signals less comfort with inflation. A close below the lower July support zone could expose 7,400 first, followed by a deeper risk area near 7,200 if volatility accelerates.
Key Levels and Catalysts to Watch
- Immediate resistance: 7,515, followed by 7,550-7,580.
- Major resistance: the 52-week high near 7,621.
- Near-term pivot: approximately 7,473, including the 50-day moving-average area
- Initial support: 7,425, then 7,400.
- Deeper downside reference: around 7,300 if selling pressure broadens.
- Catalysts: Alphabet and Tesla earnings after 22 July close, Intel earnings, U.S. jobless claims, flash PMIs, new home sales, oil-price moves, Treasury yields and the 28-29 July FOMC decision window.
Conclusion
The S&P 500 market analysis points to a short-term test of conviction around the 7,500 area. The rebound from recent lows is constructive, but it needs confirmation from earnings, calmer energy markets and stable yields. Bulls have a credible path toward 7,580 and then the all-time-high if the index holds its pivot zone, while bears may regain control if SP500 breaks below 7,425 with broader participation in the sell-off.
For retail traders, the most useful approach is to treat the next 1-2 weeks as a catalyst-heavy consolidation period rather than a clean trending environment. Earnings and the Fed can quickly change sentiment, so scenario planning and risk awareness remain more important than assuming a single outcome.

Risk disclaimer: CFDs are complex instruments and come with a high risk of losing money rapidly due to leverage. You should consider whether you understand how CFDs work and whether you can afford to take the high risk of losing your money. Never deposit more than you are prepared to lose. Professional client’s losses can exceed their deposit. Please see our risk warning policy and seek independent professional advice if you do not fully understand. This information is not directed or intended for distribution to or use by residents of certain countries/jurisdictions including, but not limited to, USA & Countries included in the OFAC sanction list. The Company holds the right to alter the aforementioned list of countries at its own discretion.
TIOmarkets offers an exclusively execution-only service. The views expressed are for information purposes only. None of the content provided constitutes any form of investment advice. The comments are made available purely for educational and marketing purposes and do NOT constitute advice or investment recommendation (and should not be considered as such) and do not in any way constitute an invitation to acquire any financial instrument or product. TIOmarkets and its affiliates and consultants are not liable for any damages that may be caused by individual comments or statements by TIOmarkets analysis and assumes no liability with respect to the completeness and correctness of the content presented. The investor is solely responsible for the risk of his/her investment decisions. The analyses and comments presented do not include any consideration of your personal investment objectives, financial circumstances, or needs. The content has not been prepared in accordance with any legal requirements for financial analysis and must, therefore, be viewed by the reader as marketing information. TIOmarkets prohibits duplication or publication without explicit approval.
Join us on social media



Authors BIO

Panagiotis is an online trading specialist with extensive experience in forex, indices, and commodities. He enjoys sharing his experience to help traders better understand global financial markets.








