


The US Economy Lost Jobs Instead of Adding Them. Gold Jumped Toward $4,370.
BY Ahmed Osama
|August 7, 2026The US economy shed 23,000 jobs in July. Markets had expected it to add 83,000. The gap runs to more than 106,000 jobs, one of the largest negative surprises in a payrolls report this year.
More telling than the size of the miss is the sign. The number came in negative, not merely weak.
Average hourly earnings slowed to 0.1% month-on-month against 0.3% expected, while the unemployment rate fell to 4.1% from 4.2% a decline that carries a contradiction worth unpacking.
The market response was immediate and sharp: gold surged toward $4,370 an ounce, the dollar dropped, and the euro climbed.
Key takeaways
- Nonfarm payrolls: -23,000 against expectations of +83,000, a miss of more than 106,000
- Unemployment fell to 4.1% from 4.2%, against forecasts for no change
- Wages slowed to +0.1% month-on-month against +0.3% expected
- Gold jumped toward $4,360, the dollar fell and the euro rose
- Fundamental indicators had already warned: ADP showed just 44,000 private jobs, and the ISM services employment index fell into contraction at 47.4
- Markets had been pricing roughly a 60% chance of a September rate hike before the release, which has now dropped to 45% according to the CME FedWatch Tool.
The contradiction: how does unemployment fall while payrolls go negative?
This is the question the numbers invite, and the answer sits in the labour force participation rate.
The report draws on two separate surveys. The establishment survey counts jobs. The household survey measures the unemployment rate. They can, and sometimes do, move in opposite directions.
The mechanism is straightforward. The unemployment rate counts jobless people as a share of the labour force, not of the total population. Anyone who stops looking for work drops out of the calculation entirely, which pushes the rate down even when labour market conditions have not improved.
This pattern is not new. In June, participation fell 0.3 percentage points to 61.5%, its lowest level since March 2021, and the unemployment rate declined that month too.
The practical reading: a fall to 4.1% in this context is not necessarily a positive signal. It may reflect people leaving the labour market rather than stronger hiring, which makes the headline rate misleading when read on its own.
Why the reaction was this volatile
To understand the size of the move, you need to know what was priced in beforehand.
The Federal Reserve held rates at 3.50% to 3.75% on July 29, but on a divided 9-3 vote, with three members preferring a quarter-point increase.
After that decision, markets continued to price roughly a 60% probability of a hike at the September meeting, down from above 80% before the Fed met.
The hawkish case rested on two pillars: elevated inflation and a resilient labour market.
This report demolished the second pillar and weakened the first through the wage data. Consequently, according to the CME FedWatch Tool, market expectations for a September rate hike have now retreated to just 45%.
Why the wage number matters most
Wage growth slowing to 0.1% monthly carries significance beyond the figure itself.
Wages are the primary transmission channel from the labour market into consumer prices. When they decelerate, the argument that employment conditions are feeding persistent inflationary pressure loses its foundation.
The three dissenters now face a materially different picture from the one they were arguing from a week ago.
How markets responded
Gold: the standout move
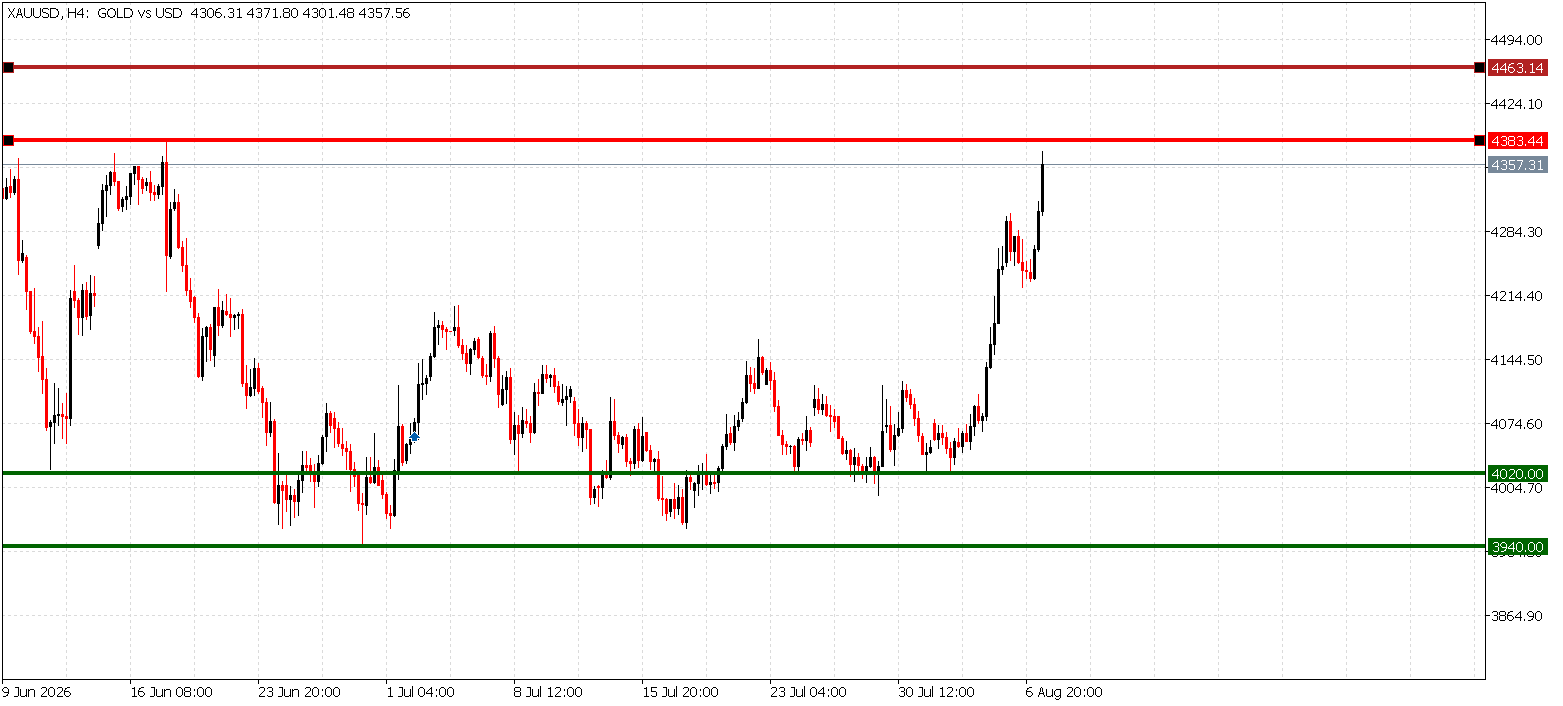
Source: TIOmarkets MT5 live XAUUSD chart, August 7, 2026.
Gold surged toward $4,370 an ounce after spending more than a month confined to a $4,000 to $4,200 range.
Three forces compounded the move:
- A weaker dollar makes gold cheaper for buyers holding other currencies
- Falling rate-hike odds reduce the opportunity cost of holding a non-yielding asset
- Breaking out of an extended range typically draws additional flows that accelerate the move
Gold had repeatedly failed to clear $4,200 in recent weeks, with the 30-year Treasury yield above 5.20% acting as the principal drag.
The dollar and the euro
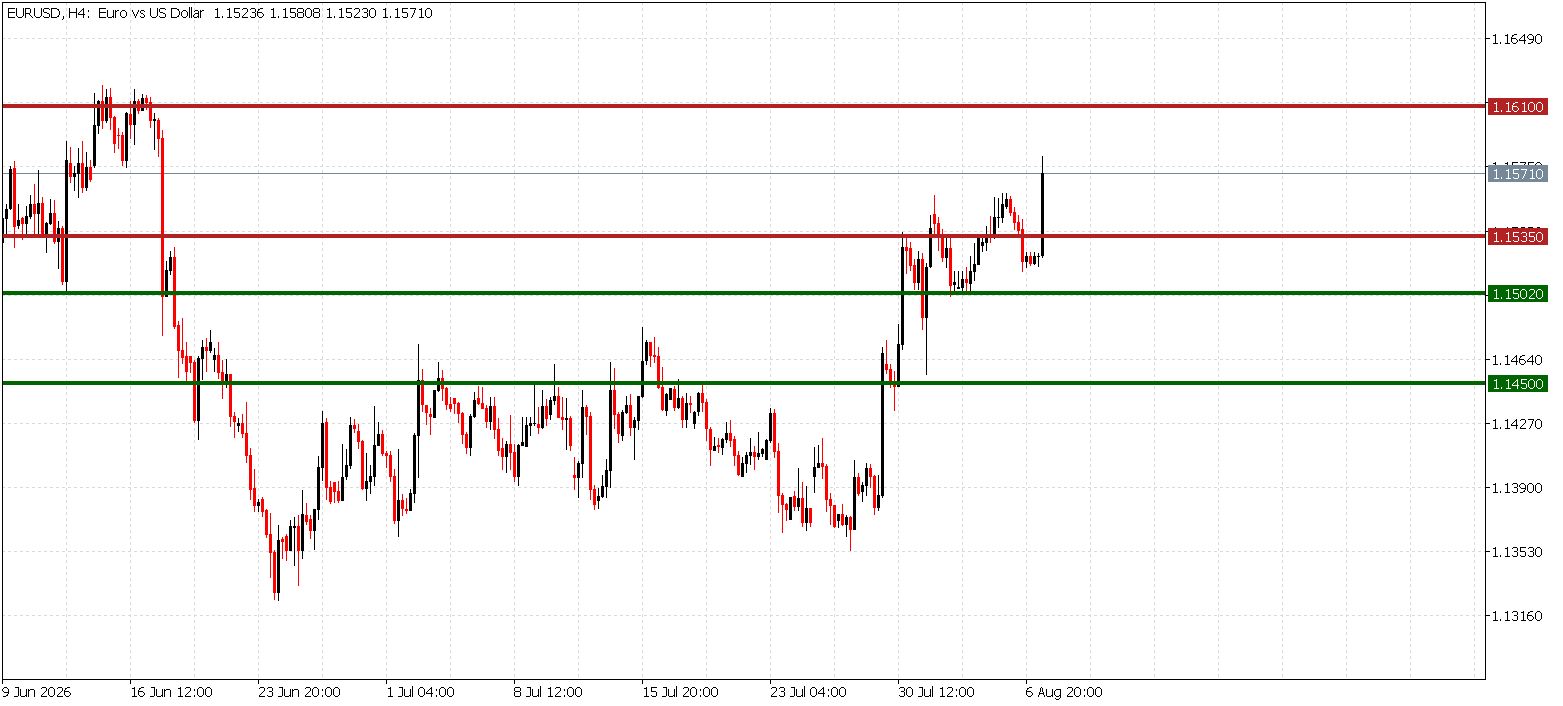
Source: TIOmarkets MT5 live EURUSD charts, August 7, 2026.
The dollar weakened across most major currencies, and EUR/USD climbed on two simultaneous drivers: dollar softness, and strong European data released earlier this week showing eurozone growth of 0.4% in the second quarter and inflation accelerating to 2.9%.
The equation has flipped within days. The euro had been moving purely on dollar direction. It now has support from both sides.
Act on Market Insights
Major economic data shapes market trends. Access the global markets with TIOmarkets to trade Gold, Forex, and Indices with reliable execution and competitive conditions.
Trading is risky
The warnings the fundamental indicators gave
For anyone tracking the run-up, this was not a complete surprise:
| Indicator | Reading | What it signalled |
| ADP private payrolls | +44,000 vs 75,000 expected | Sharp slowdown in private hiring |
| ISM services employment | Fell from 51.2 to 47.4 | Moved into contraction |
| April and May revisions | Cut by 74,000 combined | Cumulative weakness not previously visible |
Read together: the labour market had been cooling for months, but headline numbers partially masked it. This report made the slowdown impossible to miss.
What it means for markets: two scenarios
Scenario one: the dovish shift entrenches
This path could extend if upcoming data confirms labour market weakness, particularly the August 12 inflation reading and the August 19 release of the Fed's July meeting minutes.
In that case gold could continue drawing support from a softer dollar and receding tightening expectations, and EUR/USD could find additional footing.
The signal to watch: the tone of Fed officials in the coming days, and whether any of the three dissenters softens their position.
Scenario two: the move partially retraces
This could unfold if the August 12 inflation print comes in hotter than expected, since that would revive the hawkish case through its original channel.
The severity of the move is itself a caution. Large single-session jumps frequently invite profit-taking in following sessions, which is normal behaviour rather than a trend reversal.
One further consideration: a single month does not establish a trend. Monthly data is subject to later revision, and recent months have already seen substantial revisions.
Key upcoming catalysts
| Date | Event | Significance |
| August 12 | Consumer Price Index (CPI) | Very high |
| August 19 | Fed meeting minutes (July 29) | High |
| Coming days | Fed officials' commentary | High |
| September 15-16 | FOMC meeting (with dot plot) | Very high |
A note on the August minutes: they will reveal how many members were close to joining the three dissenters. Although the minutes document a discussion that preceded this report, they establish how broad the hawkish lean inside the Committee actually is.
Bottom line
July's employment report overturned the picture markets had built over recent weeks.
Instead of a resilient labour market supporting the case for higher rates, the data showed an economy losing jobs and wages decelerating, alongside a fall in unemployment that reflects withdrawal from the labour force rather than improvement within it.
The immediate result was a jump in gold, a drop in the dollar and a rise in the euro.
The real test arrives on August 12 with the inflation data. A soft print entrenches the shift. A hot one returns markets to the same unresolved tension they lived with through July.

Risk disclaimer: CFDs are complex instruments and come with a high risk of losing money rapidly due to leverage. You should consider whether you understand how CFDs work and whether you can afford to take the high risk of losing your money. Never deposit more than you are prepared to lose. Professional client’s losses can exceed their deposit. Please see our risk warning policy and seek independent professional advice if you do not fully understand. This information is not directed or intended for distribution to or use by residents of certain countries/jurisdictions including, but not limited to, USA & Countries included in the OFAC sanction list. The Company holds the right to alter the aforementioned list of countries at its own discretion.
TIOmarkets offers an exclusively execution-only service. The views expressed are for information purposes only. None of the content provided constitutes any form of investment advice. The comments are made available purely for educational and marketing purposes and do NOT constitute advice or investment recommendation (and should not be considered as such) and do not in any way constitute an invitation to acquire any financial instrument or product. TIOmarkets and its affiliates and consultants are not liable for any damages that may be caused by individual comments or statements by TIOmarkets analysis and assumes no liability with respect to the completeness and correctness of the content presented. The investor is solely responsible for the risk of his/her investment decisions. The analyses and comments presented do not include any consideration of your personal investment objectives, financial circumstances, or needs. The content has not been prepared in accordance with any legal requirements for financial analysis and must, therefore, be viewed by the reader as marketing information. TIOmarkets prohibits duplication or publication without explicit approval.
Join us on social media



Authors BIO

An experienced financial analyst and educator with over 8 years of expertise covering gold, forex, and global financial markets. Ahmed specializes in blending price action analysis with macroeconomic data to accurately interpret market movements, providing readers with comprehensive educational insights into trading and the financial world.





