


WTI Crude Oil Analysis: USOIL Tests $90 at Six-Week High
BY Ahmed Osama
|September 3, 2026WTI crude trades in the $88.50 to $90.50 area, testing the $90 level after a two-session rally lifted the benchmark to a six-week high. Brent has traded around $95, also its strongest in nearly six weeks.
The move extends a substantial recovery. USOIL has gained roughly 13% over the past month and sits about 42% above the same point last year, driven by supply risk around the Strait of Hormuz rather than by demand.
This WTI crude oil analysis covers a market with two unresolved contradictions. Transit data is sending opposite signals within 48 hours, and price now sits roughly $10 above the level the US Energy Information Administration forecasts for this quarter.
The Setup at a Glance
- USOIL testing $90, at a six-week high, up roughly 13% over the past month
- Brent around $95, also a six-week high
- Renewed US strikes on Iranian targets around the Strait drove the two-session rally
- Hormuz transit data is contradictory: 17 million barrels crossed on Monday, the most since the conflict began, but only four tanker crossings were tracked on Tuesday
- The EIA forecasts Brent averaging $85 in the third quarter, falling to $78 in the fourth, both below current levels
- The IEA expects global demand to fall roughly 1.6 million bpd in 2026
- US payrolls land Thursday 4 September, with OPEC+ meeting 6 September and the EIA outlook on 9 September
What drove the two-session rally
The catalyst was specific and recent.
US forces launched fresh strikes against Iranian targets around the Strait of Hormuz. President Trump described them as retaliation for attempts to lay mines in the waterway and for an earlier attack on a US military base, and indicated a larger response would follow any retaliation. Iran stated that it had already responded by targeting US bases in the region.
The market response was immediate, lifting both benchmarks to six-week highs.
A separate comment removed a diplomatic anchor. President Trump said he "couldn't care less" whether Iran signs an agreement to reopen the Strait, which markets read as reducing the probability of a negotiated resolution in the near term.
The contradiction in the transit data
This is the most important detail in the current picture, and it explains why the price is unstable rather than trending cleanly.
Two data points, 24 hours apart, point in opposite directions:
- US Energy Secretary Chris Wright stated that more than 17 million barrels transited the Strait on Monday, the highest daily volume since the conflict began in late February. Pre-conflict throughput was roughly 20 million barrels per day
- Kpler tracked only four tanker crossings on Tuesday, with traffic remaining below its ten-day average
Both can be true. A single high-volume day can reflect a backlog clearing during a window of relative calm, while the following day reverts to constrained flow. But the two figures produce completely different conclusions about whether the disruption is easing.
The practical implication: the market currently has no reliable read on normalisation. That is why headlines are moving price more than physical data, and why moves through technical levels have been reversing quickly.
The forecast gap
Price is now well above the level the official outlook assumes for this quarter.
The EIA's August outlook forecasts the Brent spot price averaging around $85 per barrel in the third quarter of 2026, falling to an average of $78 by the fourth quarter as Hormuz traffic increases and shut-in production restarts, then to $69 across 2027.
Brent is trading around $95. That is roughly $10 above the current-quarter assumption, with one month of the quarter remaining.
The agency's assumption is explicit and dated. It completed the forecast on 6 August and assumed severe Hormuz constraints would persist through August, with flows slowly increasing from September. It also expects residual disruption of about 0.6 million barrels per day through the end of 2027.
This makes the 9 September update unusually consequential. It is the first opportunity for the agency to either move its assumptions toward the market or restate a path implying current prices are elevated relative to the expected balance.
The demand counterweight
Two data points pull against the supply premium.
The IEA expects global oil demand to decline by roughly 1.6 million barrels per day in 2026. That is demand destruction caused partly by the same event driving the supply premium, since sustained high prices erode consumption.
Chinese buying has weakened. July crude imports fell 24.3% year on year, though they rose 22% against June. The annual decline reflects a combination of domestic demand, elevated prices and constrained supply routes.
On the supply side, OPEC+ completed the rollback of its voluntary cuts with the September increase agreed on 2 August. Roughly 2 million barrels per day of separate cuts dating to 2022 remain in place until year-end. Analyst commentary has pointed toward a fourth-quarter pause as the base case, though the group's statement made no reference to it.
USOIL technical analysis
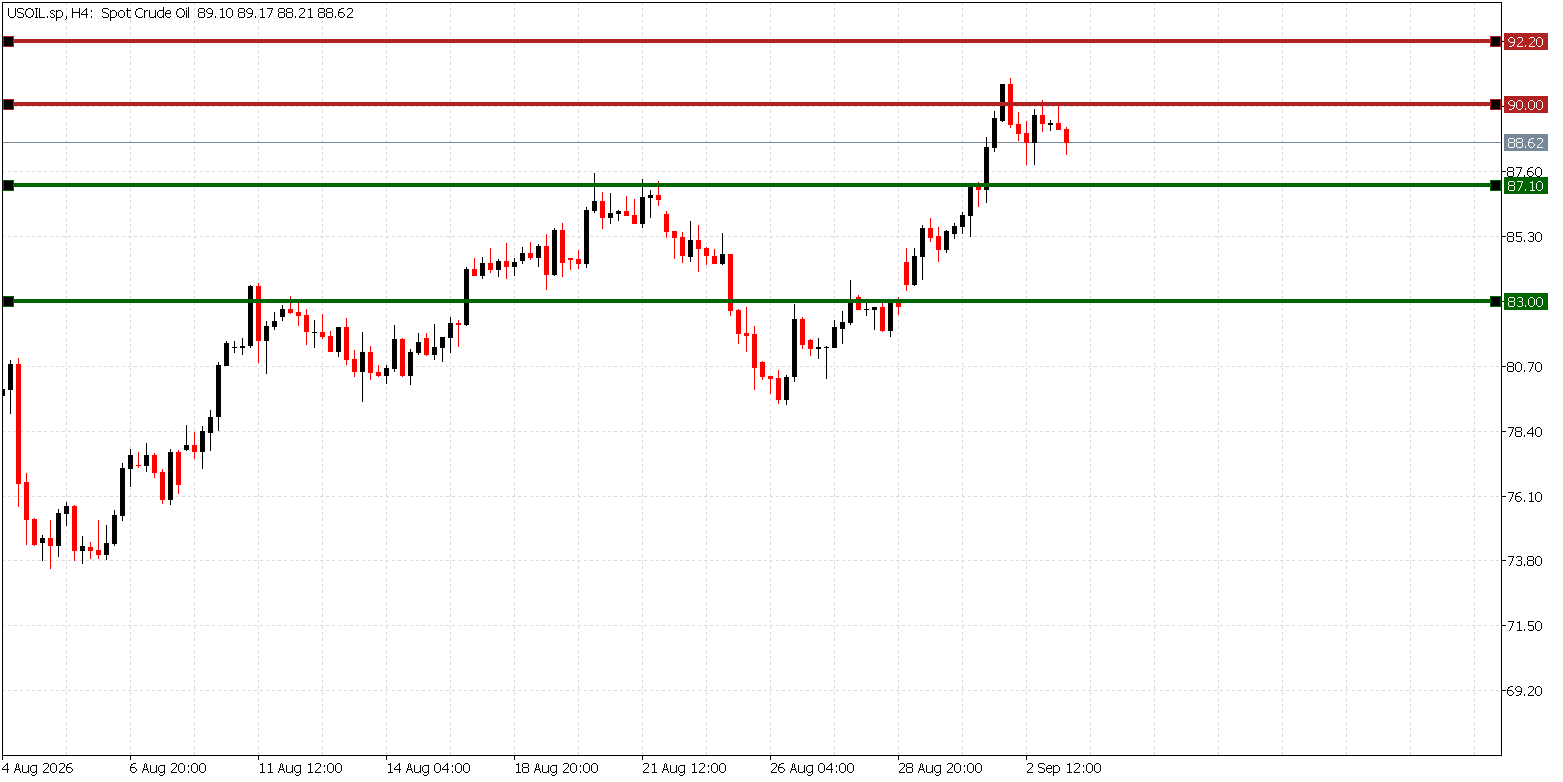
Source: TIOmarkets MT5 live USOIL chart
The daily structure has improved in stages. USOIL recovered from an early-August low near $73.50, reclaimed the late-August $85 to $86 congestion, cleared the $87.10 to $87.40 band, and is now testing $90.
Resistance levels to watch:
- $90.00: the psychological level currently being tested, and the immediate decision point
- $92.20: the next reference area on a confirmed break
- Beyond that, structure thins until the late-July spike zone
Support levels to watch:
- $87.10 to $87.40: the band cleared during the rally, now the first support
- $85.30: the retest area that held through late August
- $82.80 to $83.00: the level below which the rebound structure weakens materially
- $79.30 to $80.60: the deeper reference, with the early-August low at $73.50 beneath it
The structural read is constructive while price holds above $87.10, with a sequence of higher lows intact since early August.
But two cautions apply. A gain of roughly 13% in a month without a meaningful correction leaves the market extended. And because the advance is headline-driven, levels can be cleared and reversed within a single session, which makes a confirmed daily close more informative than an intraday breach.
Bullish scenario: 3-12 September
This bullish WTI crude oil analysis scenario may strengthen if Hormuz transit remains constrained, further incidents occur, or the 6 September OPEC+ meeting produces a cautious message on fourth-quarter output.
A sustained daily close above $90.00 would open $92.20.
Supporting factors include a weaker dollar following Thursday's payroll report, an EIA outlook on 9 September that revises its disruption assumptions upward, a larger-than-expected US crude draw when the delayed report arrives, and continued evidence that shut-in production is not returning.
Invalidation: a decisive return below $83.00 would suggest the advance has failed.
Bearish scenario: 3-12 September
The bearish case may strengthen if transit volumes confirm the Monday figure rather than the Tuesday one, diplomatic signals resume, or the delayed inventory report shows another meaningful build.
A daily close below $83.00 would shift attention to $80.60 and $79.30, and a break of $79.30 could expose the early-August low near $73.50.
Supporting factors include a firmer dollar on strong payrolls, an EIA outlook that holds its normalisation path, further evidence of Chinese demand weakness, or an OPEC+ decision to add supply rather than pause.
Invalidation: a sustained close above $90.00 would challenge this view.
A note on market mechanics. This market is pricing the probability of interruption rather than a measured supply balance, and the transit data currently supports two opposite conclusions. Prices set that way move on headlines rather than on data, which is why position sizing carries more weight here than in a fundamentally driven market.
Key levels and catalysts
| Item | Detail |
| Resistance | $90.00, then $92.20 |
| Support | $87.10 to $87.40, then $85.30, then $82.80 to $83.00, then $79.30 to $80.60 |
| Reference low | $73.50 (early August 2026) |
| Thursday 4 September | US Employment Situation report, relevant through the dollar channel |
| 6 September | OPEC+ meeting, with any guidance on fourth-quarter output |
| 9 September | EIA Short-Term Energy Outlook, with updated assumptions |
| 10 September | EIA weekly petroleum status report, delayed by the Labor Day schedule |
| Ongoing | Strait of Hormuz transit volumes, US crude inventories, the dollar, Chinese demand |
Conclusion
This WTI crude oil analysis describes a market at a six-week high with two unresolved contradictions beneath it.
The first is in the transit data. Monday produced the highest Hormuz throughput since the conflict began; Tuesday produced four tanker crossings. Until one of those patterns proves durable, the market has no reliable read on whether disruption is easing.
The second is between price and forecast. Brent trades around $95 while the official outlook has it averaging $85 this quarter and $78 next. The 9 September update is the first indication of which side moves.
The $90.00 level is the immediate decision point. A confirmed daily close above it opens $92.20; failure there, with a loss of $87.10, would suggest the rally was another headline spike. Thursday's payroll report and Sunday's OPEC+ meeting arrive before any fresh inventory data.

Risk disclaimer: CFDs are complex instruments and come with a high risk of losing money rapidly due to leverage. You should consider whether you understand how CFDs work and whether you can afford to take the high risk of losing your money. Never deposit more than you are prepared to lose. Professional client’s losses can exceed their deposit. Please see our risk warning policy and seek independent professional advice if you do not fully understand. This information is not directed or intended for distribution to or use by residents of certain countries/jurisdictions including, but not limited to, USA & Countries included in the OFAC sanction list. The Company holds the right to alter the aforementioned list of countries at its own discretion.
TIOmarkets offers an exclusively execution-only service. The views expressed are for information purposes only. None of the content provided constitutes any form of investment advice. The comments are made available purely for educational and marketing purposes and do NOT constitute advice or investment recommendation (and should not be considered as such) and do not in any way constitute an invitation to acquire any financial instrument or product. TIOmarkets and its affiliates and consultants are not liable for any damages that may be caused by individual comments or statements by TIOmarkets analysis and assumes no liability with respect to the completeness and correctness of the content presented. The investor is solely responsible for the risk of his/her investment decisions. The analyses and comments presented do not include any consideration of your personal investment objectives, financial circumstances, or needs. The content has not been prepared in accordance with any legal requirements for financial analysis and must, therefore, be viewed by the reader as marketing information. TIOmarkets prohibits duplication or publication without explicit approval.
Join us on social media



Authors BIO

An experienced financial analyst and educator with over 8 years of expertise covering gold, forex, and global financial markets. Ahmed specializes in blending price action analysis with macroeconomic data to accurately interpret market movements, providing readers with comprehensive educational insights into trading and the financial world.








