


Bollinger Bands Strategy for Forex: Squeeze, Walk, Bounce
BY Panagiotis Philippou
|October 22, 2026Bollinger Bands are among the most familiar lines on a forex chart. Yet many traders use them in only one way, treating every touch of a band as a turning point. That habit can work in one kind of market and fail badly in another.
A Bollinger bands strategy is a set of rules for reading price against a moving average and two volatility bands, then choosing a setup that fits the market: a squeeze breakout when volatility is low, a band walk in a trend, or a mean-reversion bounce in a range.
This guide walks through that framework step by step. You will learn how the bands are built, which settings suit currency pairs, how to read the market with Bandwidth and %B, and how each of the three classic setups works on EUR/USD, GBP/USD and USD/JPY. It ends with stops, position sizing, the method's limits and how to test it.
How Do Bollinger Bands Work on Currency Pairs?
John Bollinger created the bands in the early 1980s. They are made of three lines drawn around price. Each line answers a simple question: where is the recent average, and how far is price from it?
- Middle band: usually a 20-period simple moving average (SMA), which is the plain average of the last 20 prices on the chart.
- Upper band: the 20-period SMA plus two standard deviations.
- Lower band: the 20-period SMA minus two standard deviations.
Standard deviation is a statistical measure of how widely prices have spread around their average. When prices swing a lot, it grows. When they barely move, it shrinks. That is why the upper and lower bands widen as volatility increases and narrow as it decreases.
On EUR/USD, for example, the bands tighten during quiet spells and spread apart when the pair moves sharply. So the bands do two jobs at once. They show a rough "normal" zone for price, and their width shows how active the market is.
A touch of a band means price is stretched compared with its recent average. It does not mean price must turn. The bands do not give absolute buy or sell signals just because price has touched them, which is why they are usually read alongside another indicator.
Bollinger Band Settings for Forex Pairs
The standard setting is a 20-period average with bands two standard deviations away. Both numbers can be changed. The period is counted in candles, so on an hourly chart it covers 20 hours and on a daily chart 20 days.
A common adjustment links the multiplier to the period. A longer average uses a slightly wider multiple, such as 2.1 at 50 periods. A shorter average uses a narrower one, such as 1.9 at 10 periods. This keeps the bands covering a similar share of price action.
- Shorter settings react faster, so price touches the bands more often. That also means more false signals.
- Longer settings are smoother and slower. They filter noise but react later to real changes.
Many chartists keep the same settings across GBP/USD, USD/JPY and EUR/USD so readings stay comparable. Tweaking the numbers until they fit past charts perfectly is a trap. Settings tuned to old data often behave differently on new data.
Reading the Market First: How to Use Bollinger Bandwidth and %B
The core idea of this framework is simple: diagnose the market before picking a setup. Two companion readings, both built from the bands, help with that diagnosis.
The Bandwidth indicator measures how wide the bands are. Its formula is (Upper Band − Lower Band) / Middle Band × 100. A falling line means volatility is shrinking. A rising line means it is expanding.
There is no universal "narrow" number. What counts as low depends on the instrument. USD/JPY's usual Bandwidth may differ from GBP/USD's, so each pair is best compared with its own history rather than with another pair.
The %B indicator shows where price sits inside the bands. Its formula is (Current Price − Lower Band) / (Upper Band − Lower Band). Here is how to read it:
- 1 means price is at the upper band; above 1 means price is above it.
- 0 means price is at the lower band; below 0 means price is below it.
- 0.50 means price is on the middle line.
- 0.80 and 0.20 mark price nearing the upper and lower bands.
Together, these readings suggest which of three conditions the pair is in:
- Quiet: Bandwidth is falling toward the low end of its own history. This is the squeeze condition.
- Trending: the bands are widening and %B keeps pushing above 1 or below 0, while rarely crossing back through 0.50. This is the band-walk condition.
- Ranging: Bandwidth is fairly steady and %B swings between the 0.20 and 0.80 zones, crossing 0.50 again and again. This is the mean-reversion condition.
These labels are a way of organising what you see, not a promise about what comes next. Conditions can change within a few candles.
Bollinger Bands Strategy 1: How Do You Trade a Bollinger Band Squeeze?
A volatility squeeze happens when the bands pinch tightly together because the market has gone quiet. One common definition is Bandwidth falling to a six-month low. The idea behind the Bollinger band squeeze strategy in forex is that quiet periods can be followed by bigger moves.
The squeeze itself says nothing about direction. A close outside the bands after a squeeze hints at which way the breakout is going. Traders who use this setup usually describe it in steps:
- Spot the squeeze: Bandwidth near the low end of the pair's own history.
- Wait for a candle to close outside one band, rather than reacting to a brief poke during the candle.
- Look for a second piece of evidence, such as momentum from another indicator.
- Decide in advance what would show the idea was wrong, such as price returning inside the squeeze range.
Worked example: imagine GBP/USD drifting sideways on the daily chart for weeks. Bandwidth slides to a six-month low and %B hovers around 0.50. Then a candle closes above the upper band, pushing %B above 1. That close is the hint of direction this setup looks for.
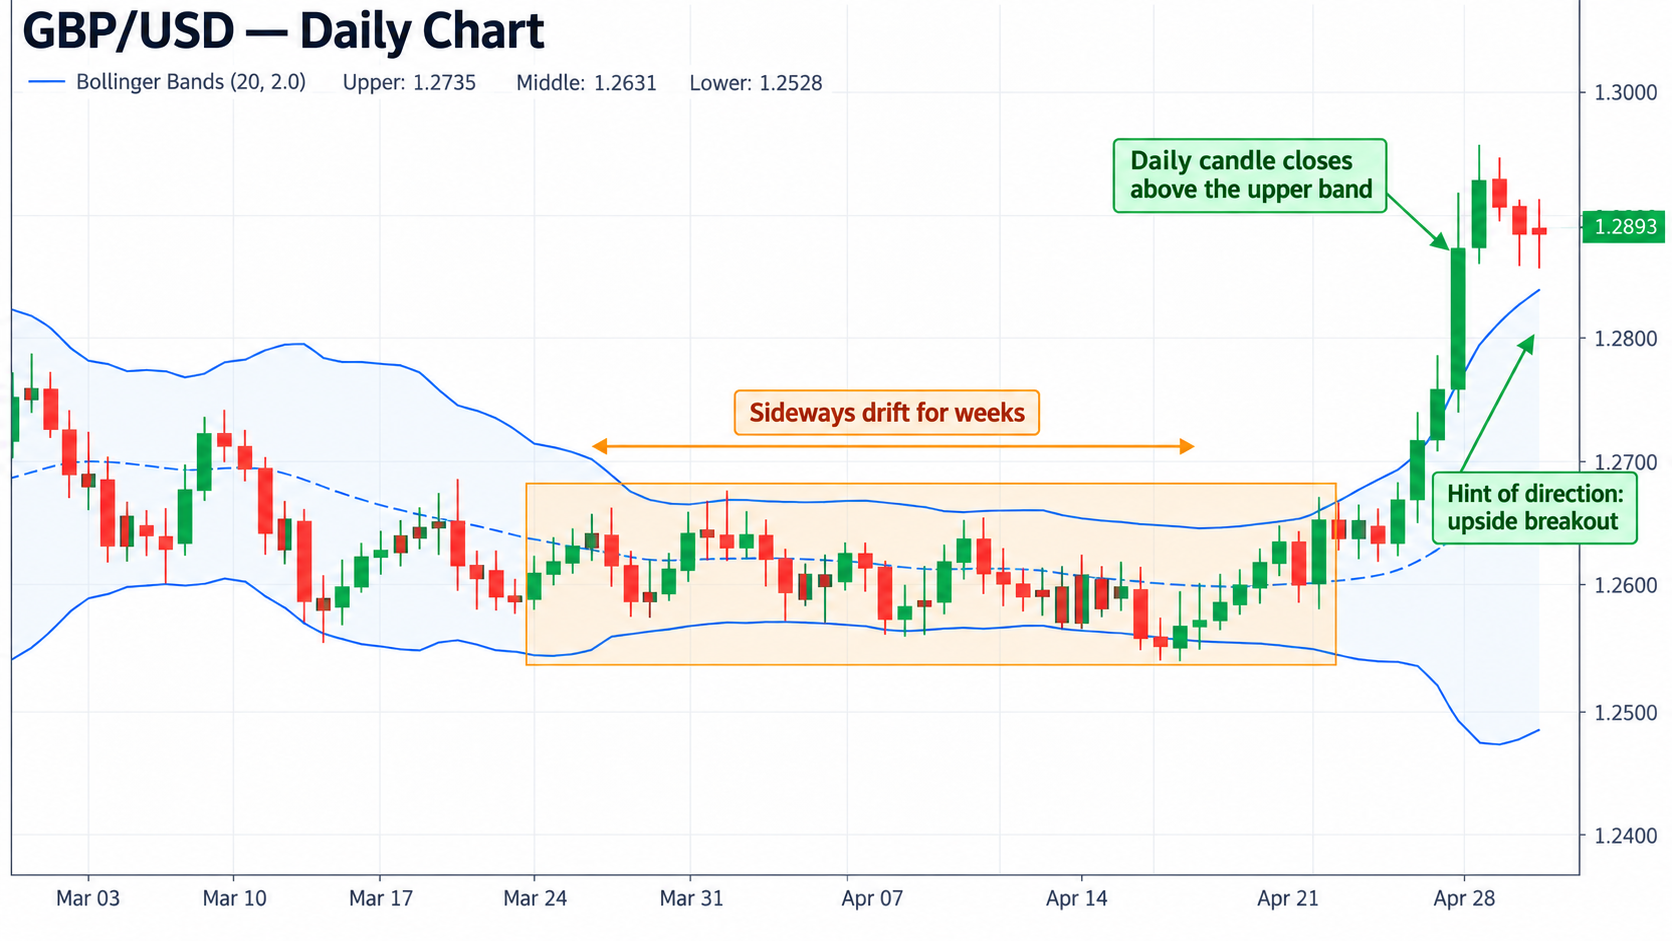
The main danger is a false breakout: price closes outside the bands, then quickly falls back inside and sometimes breaks the other way. Squeezes often form before major data releases, when gaps and sudden reversals can occur. Leverage magnifies losses as well as gains, losses can build quickly in a fast breakout, and traders can lose all the money they deposit.
Bollinger Bands Strategy 2: How to Trade the Bollinger Band Walk
Walking the bands describes price hugging the upper band in a strong uptrend, or the lower band in a strong downtrend, for many candles in a row. In that situation, repeated breaks above the upper band or below the lower band are not reversal signals.
A tag of the upper band is not in itself a sell signal. In trending markets, price tends to walk up the upper band during a rise and down the lower band during a fall.
The band walk belongs to trend following, an approach that aims to stay with an existing move instead of guessing where it ends.
Worked example: picture USD/JPY in a steady uptrend. Daily candles keep closing near or above the upper band, %B repeatedly reads above 1, and dips stop around the middle line instead of reaching the lower band.
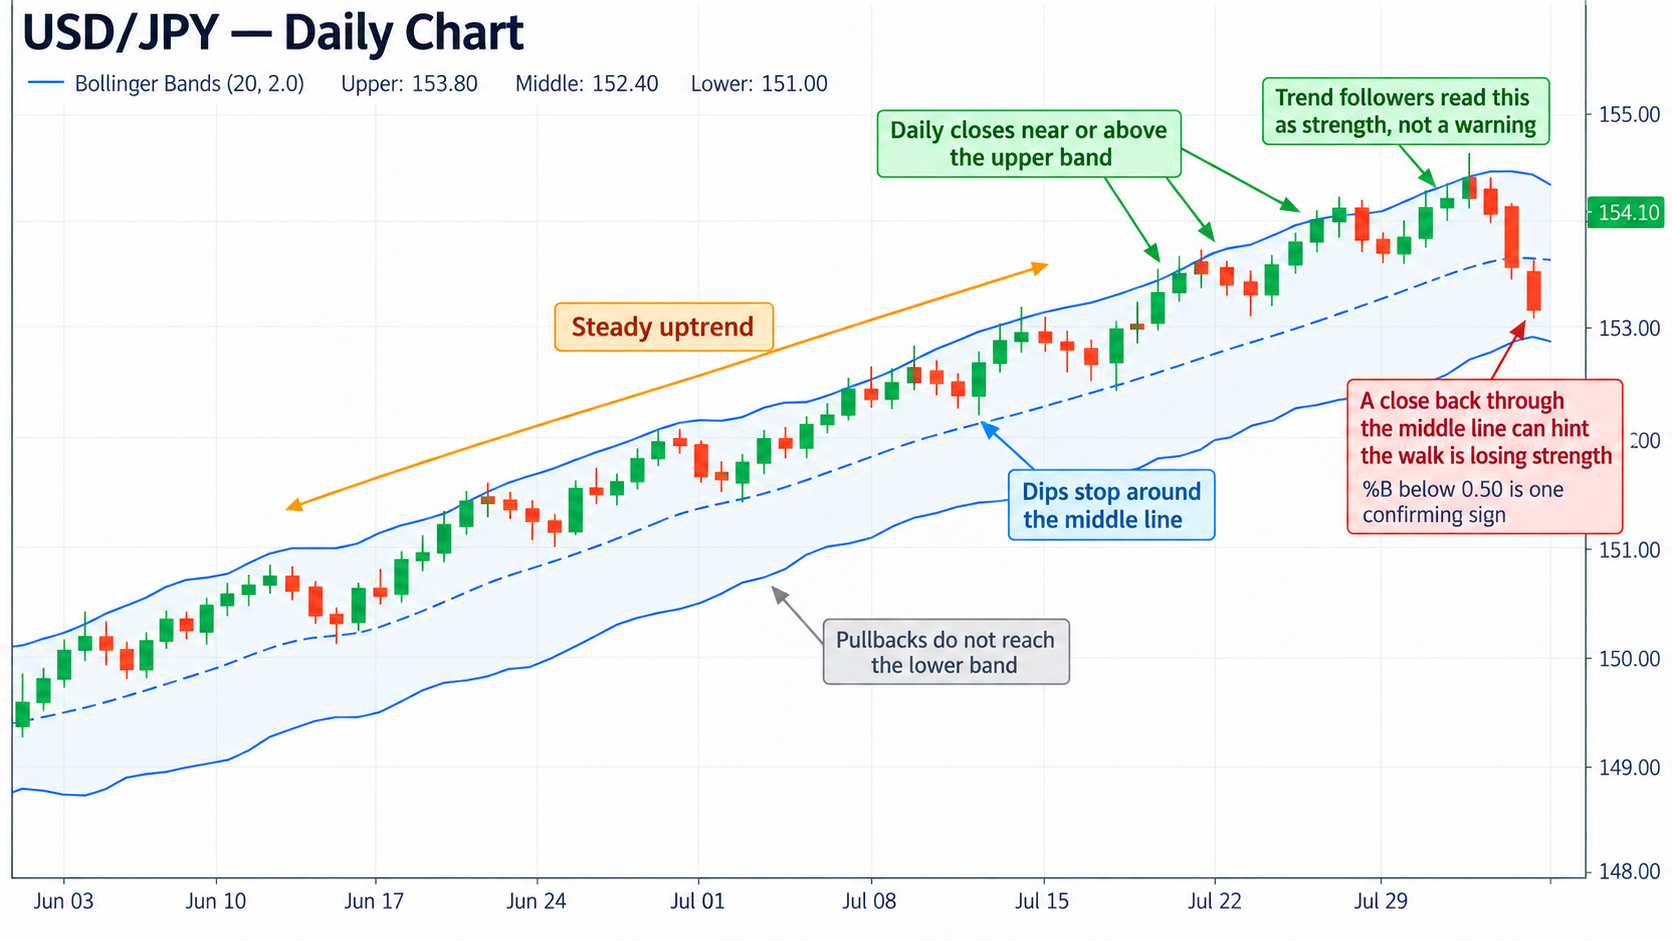
In that picture, trend followers treat the closes near the upper band as strength, not as a warning. Many watch the middle line as a reference. A close back through it, with %B falling below 0.50, is one sign the walk may have lost strength.
Trends can end abruptly, often on news, and a walk can turn into a sharp reversal within a single session. Leverage magnifies losses as well as gains, a reversal can wipe out an open position quickly, and traders can lose all the money they deposit.
Bollinger Bands Strategy 3: The Mean Reversion Bounce in Ranging Markets
Mean reversion is the idea that a stretched price tends to drift back toward its average. A ranging market is one that moves sideways between a rough ceiling and floor, with no clear trend. Bollinger bands mean reversion in forex works on that combination.
In a range, price has often drifted back toward the middle line after touching a band. Even so, a touch alone is not a buy or sell signal. Traders using this setup look for evidence that price is actually turning, not just that it has reached the band.
Worked example: suppose EUR/USD has moved sideways on the hourly chart and Bandwidth is flat. Price dips to the lower band and %B falls below 0.20. A mean-reversion trader would then watch for signs that selling is fading. In a range like this, the middle line (a %B of 0.50) is simply the average that price has often drifted back toward.
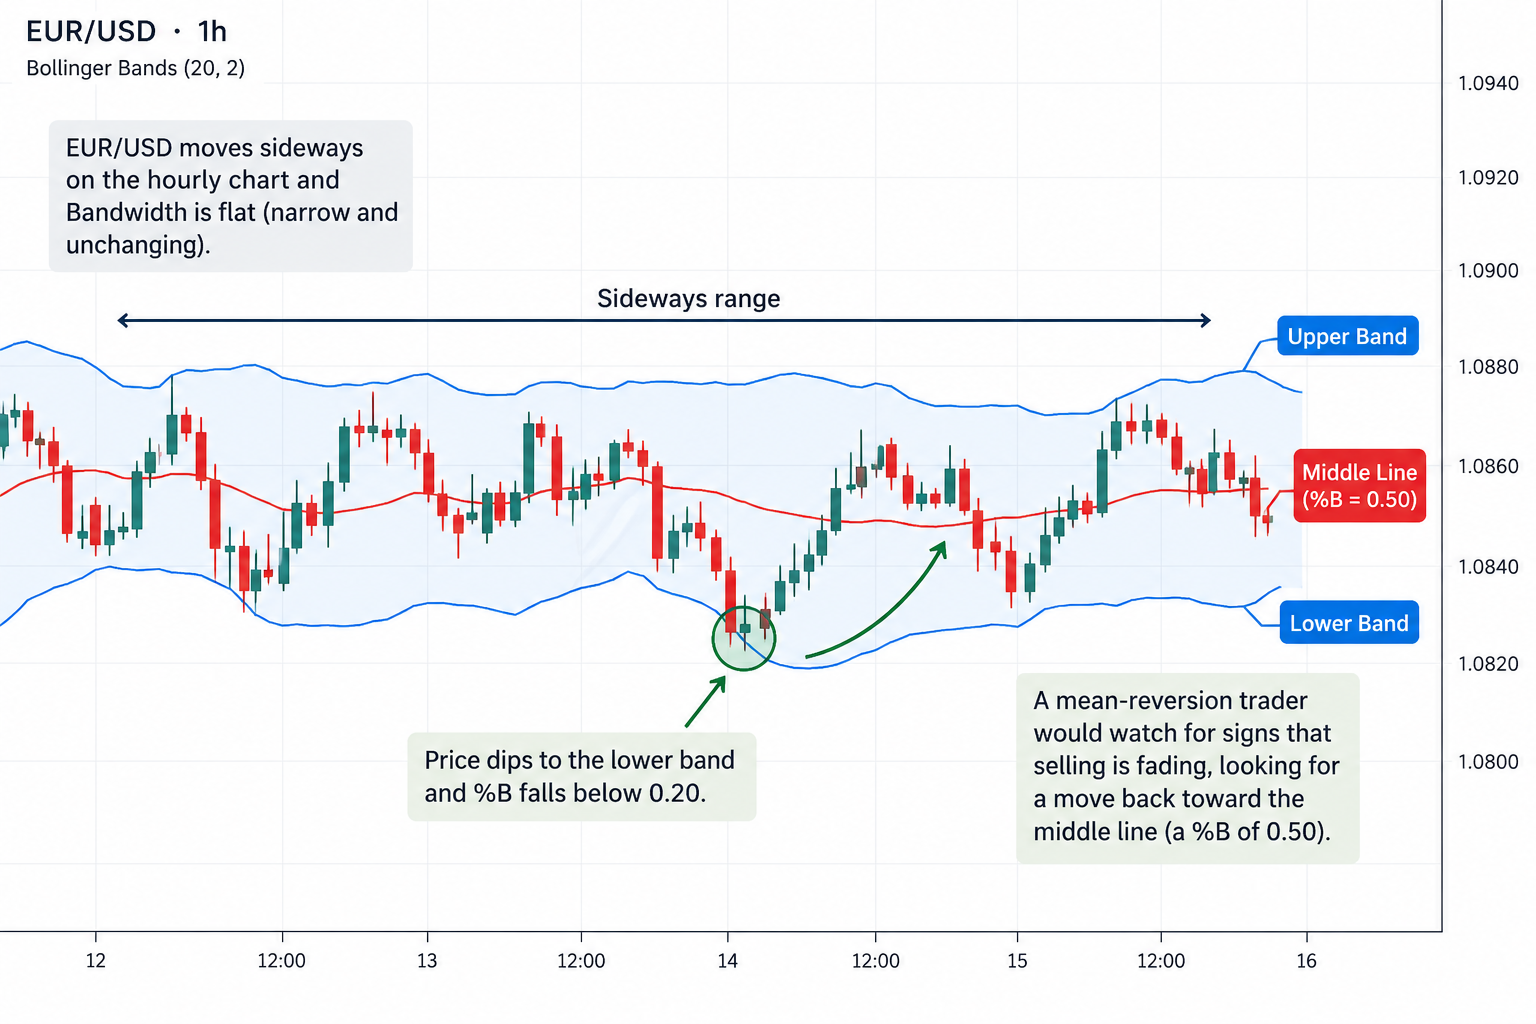
The biggest risk is a range that turns into a trend. When that happens, the "bounce" never comes and price starts walking the band instead. A rising Bandwidth is an early warning that the range may be breaking. Leverage magnifies losses as well as gains, losses can build quickly, and traders can lose all the money they deposit.
Bollinger Bands with RSI Confirmation, Stops and Position Sizing
Can you combine Bollinger bands with RSI? Yes, and pairing the bands with a second indicator is common, since a band touch alone is not a signal. The Relative Strength Index (RSI) is a momentum indicator scaled from 0 to 100. Its most common setting is 14 periods. Readings of 70 or higher suggest overbought conditions, and 30 or lower suggest oversold.
- In a range: a lower-band touch with RSI at 30 or below gives two separate signs that price is stretched.
- In a trend: RSI can stay above 70 for a long time during a band walk. Overbought there describes strength, not a reversal.
- After a squeeze: RSI moving in the same direction as the breakout close adds some support to the move.
A stop loss order is an instruction to close a trade automatically if price reaches a level chosen in advance. There is no single correct place for it. Common approaches tie the stop to the point where each setup's logic breaks:
- Squeeze breakout: beyond the opposite side of the quiet range that formed during the squeeze.
- Band walk: beyond the middle line or the most recent swing against the trend.
- Mean reversion: beyond the recent extreme outside the band, leaving room for normal noise.
Some traders add a buffer based on the Average True Range (ATR), which measures how far a pair typically moves per candle. A stop based on ATR adapts to calm and busy markets. Stops are not a perfect shield: in fast markets they can fill at a worse price than requested, which is known as slippage.
Position sizing means choosing the trade size so that a stop being hit costs only an amount decided in advance. The wider the stop, the smaller the position needs to be for the same loss. A pip is the smallest standard price move in a pair, and pip value is how much money one pip is worth at a given trade size. Size comes from the stop distance and the pip value, not from how confident a setup looks.
Leverage lets a trader open a larger position with a smaller deposit, called margin. ESMA-style limits are caps on retail leverage modelled on rules from the European Securities and Markets Authority, an EU regulator, and they apply only in some regions. Under these limits, maximum retail leverage is 30:1 (3.33% margin) on major currency pairs and 20:1 (5% margin) on other pairs.
Where these limits apply, negative balance protection is also required. This is a rule meant to stop losses going beyond the account balance. It does not reduce the risk to the money in the account, and it is not in place everywhere.
Leverage magnifies losses as well as gains. A small move against a large position can cause losses that build quickly, and traders can lose all the money they deposit.
Limits of a Bollinger Bands Strategy and How to Test One
Every line on the chart is calculated from past prices. The bands describe what has happened, so they lag behind new moves. No reading can tell you which condition will come next, and a setup can fail even when every rule is met.
Evidence also counsels caution. A 2007 academic study found that, after transaction costs, Bollinger Band rules consistently failed to beat buy and hold, which means simply buying and keeping the asset. Past performance is not a reliable indicator of future results, in either direction.
Backtesting means applying fixed rules to historical charts to see how they would have behaved. It cannot predict results, but it shows how a Bollinger bands strategy acts across different conditions and where it struggles. A structured test looks like this:
- Write the rules down exactly: condition, trigger, confirmation, stop and size.
- Test them on several pairs, such as EUR/USD, GBP/USD and USD/JPY, across quiet, trending and ranging periods.
- Include costs such as the spread and overnight swap, since these can turn a small edge on paper into a loss.
- Forward test on a demo account to practise with virtual money in live conditions.
- Keep a journal of every trade, including which condition was diagnosed and whether it held.
Backtest results are history too. They can look better than live trading because real fills, slippage and emotions are missing from old charts.
Conclusion
This framework treats the bands as a diagnosis tool rather than a trigger. Bandwidth and %B describe whether a pair is quiet, trending or ranging. Each condition links to one setup: the squeeze breakout, the band walk or the mean-reversion bounce.
A second indicator, a planned stop, position sizing and testing are the parts that frame each setup's risk. Every reading and test result describes the past. Leverage magnifies losses as well as gains, losses can build quickly, and traders can lose all the money they deposit.

FAQ
Risk disclaimer: CFDs are complex instruments and come with a high risk of losing money rapidly due to leverage. You should consider whether you understand how CFDs work and whether you can afford to take the high risk of losing your money. Never deposit more than you are prepared to lose. Professional client’s losses can exceed their deposit. Please see our risk warning policy and seek independent professional advice if you do not fully understand. This information is not directed or intended for distribution to or use by residents of certain countries/jurisdictions including, but not limited to, USA & Countries included in the OFAC sanction list. The Company holds the right to alter the aforementioned list of countries at its own discretion.
TIOmarkets offers an exclusively execution-only service. The views expressed are for information purposes only. None of the content provided constitutes any form of investment advice. The comments are made available purely for educational and marketing purposes and do NOT constitute advice or investment recommendation (and should not be considered as such) and do not in any way constitute an invitation to acquire any financial instrument or product. TIOmarkets and its affiliates and consultants are not liable for any damages that may be caused by individual comments or statements by TIOmarkets analysis and assumes no liability with respect to the completeness and correctness of the content presented. The investor is solely responsible for the risk of his/her investment decisions. The analyses and comments presented do not include any consideration of your personal investment objectives, financial circumstances, or needs. The content has not been prepared in accordance with any legal requirements for financial analysis and must, therefore, be viewed by the reader as marketing information. TIOmarkets prohibits duplication or publication without explicit approval.
Join us on social media


Authors BIO

Panagiotis is an online trading specialist with extensive experience in forex, indices, and commodities. He enjoys sharing his experience to help traders better understand global financial markets.