


Gold Price Analysis: Retail Sales Test Gold Near 1-Year Low
BY Ahmed Osama
|November 16, 2026The gold price is trading near $3,850 an ounce on Monday, 16 November 2026, close to its lowest level in more than a year, as traders prepare for Tuesday's US retail sales report. In this gold price analysis, we look at why XAU/USD has come under pressure, what the October retail sales and core retail sales figures could mean for the Federal Reserve, and the key levels on the 4-hour chart.
Key points
- Gold has fallen from around $4,140 to near $3,850 since 10 November, after US inflation came in above expectations.
- Markets widely expect the Fed to raise interest rates at its 9 December meeting.
- US retail sales for October are due on Tuesday 17 November at 13:30 UTC.
- Key chart levels: resistance at 4,150 and 4,400, support at 3,700 and 3,500.
Gold Price Today: Why XAU/USD Is Under Pressure
The latest leg lower started on 10 November, when the October consumer price index came in above expectations, with core inflation rising 0.3% on the month. On the same day, Fed Governor Christopher Waller said he is leaning towards a rate hike in December and that a larger 0.50% move could be considered if core inflation stays near 0.3%. You can read the background in our US CPI preview.
Higher rate expectations tend to lift US bond yields and the dollar. Because gold pays no interest, it often becomes less attractive when yields rise, and a stronger dollar makes it more expensive for buyers using other currencies. The Fed's policy rate currently stands at 4.00% (target range 3.75% to 4.00%), and markets widely expect it to rise in December.
Energy prices add to the pressure. Brent crude is trading above $90 a barrel, which keeps inflation concerns alive and supports the case for tighter policy. Gold is now more than 30% below its record high near $5,595, set in late January 2026. Past performance is not a reliable indicator of future results.
US Retail Sales: Date, Time and Forecast
| Indicator | Date and time (UTC) | Forecast | Previous |
| Retail Sales m/m (October) | Tuesday 17 November, 13:30 | 0.2% | 0.8% |
| Core Retail Sales m/m (October) | Tuesday 17 November, 13:30 | 0.4% | 0.9% |
Forecasts can change before the release. Check the latest figures on our economic calendar.
What Are Retail Sales and Core Retail Sales?
Retail sales measure the monthly change in the value of sales at US retailers and restaurants, published by the US Census Bureau. Because the figure is not adjusted for inflation, higher prices can lift it even when people buy the same amount of goods.
Core retail sales exclude car sales, which tend to swing sharply from month to month. Many traders also watch the control group, which removes autos, gasoline, building materials and restaurants, because it feeds directly into US economic growth data.
This detail mattered in September. Headline sales rose 0.8%, well above the 0.3% forecast, but much of that came from higher gasoline prices. The control group rose only 0.1%, below the 0.3% forecast. Consumer spending is a large part of the US economy, so strong sales can give the Fed more room to raise rates, while weak sales can ease that pressure. That is why the details matter as much as the headline in any gold price analysis around this release.
Gold Price Analysis: Retail Sales Scenarios
For this gold price analysis, better than expected means the actual figure comes in above the forecast, and worse than expected means it comes in below. The table below shows how each outcome could affect gold. The possible reactions are general patterns, not certainties, and markets may also react to revisions of earlier months.
| Scenario | Retail Sales m/m | Core Retail Sales m/m | What it could mean for gold |
| Better than expected | 0.4% or higher | 0.6% or higher | Could strengthen the case for a larger Fed hike, support the dollar and add pressure on gold. |
| As expected | 0.1% to 0.3% | 0.3% to 0.5% | May have a limited effect, with attention shifting to the FOMC minutes on Wednesday. |
| Worse than expected | 0.0% or lower | 0.2% or lower | Could ease some rate hike concerns and offer gold short-term support. |
Gold Price Analysis: Key Technical Levels
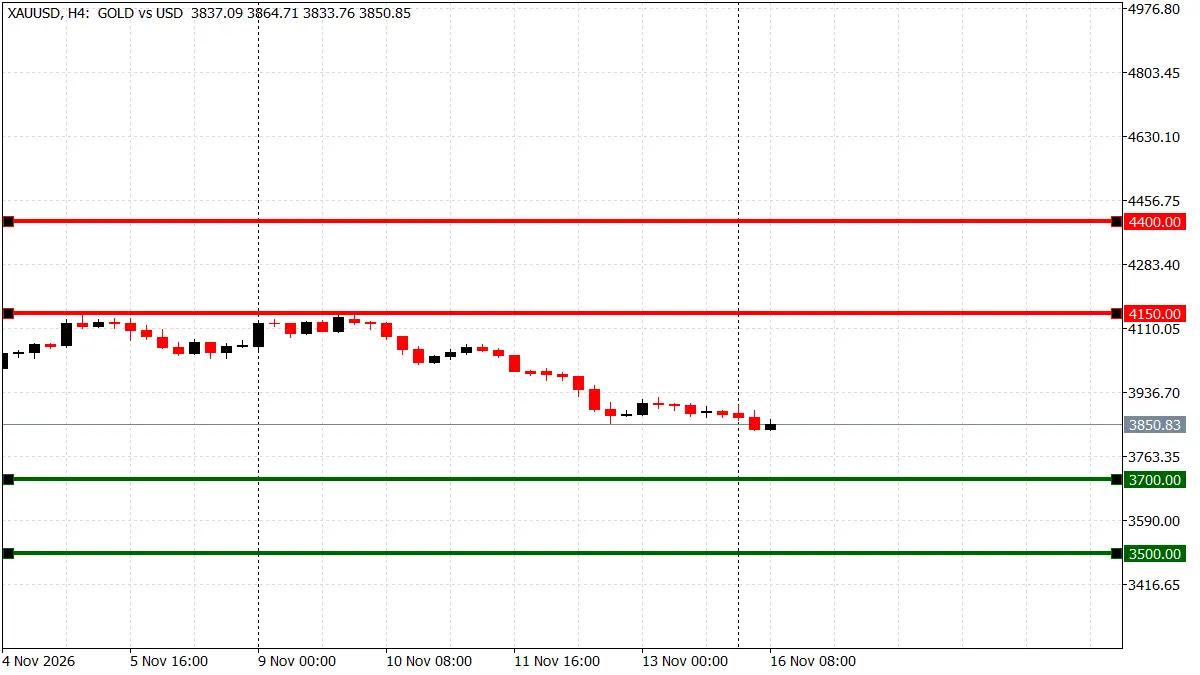
Source: TIOmarkets MT5, XAUUSD H4 chart, 16 November 2026.
On the 4-hour chart, XAU/USD has formed a series of lower highs since mid-September, and two rebound attempts in early November both stalled below 4,150. The price is now trading at or slightly below the late-October lows, which keeps the short-term structure tilted to the downside.
| Level | Price | Why it matters |
| Resistance 2 | 4,400 | Area of the mid-September highs |
| Resistance 1 | 4,150 | Early November highs, where rebounds stalled |
| Support 1 | 3,700 | Round-number area below the recent lows |
| Support 2 | 3,500 | Major psychological level and wider support area |
From a gold price analysis point of view, a sustained move above 4,150 could ease near-term selling pressure, while a break below 3,700 could open the way towards the 3,500 area. Gold can move sharply around data releases, so many traders plan their position size and stop orders before the news. Our guide to margin trading explains how leverage affects your account in fast markets.
Trade XAU/USD Around Key US Data
Prepare for Tuesday's US retail sales release on MT4, MT5, or the TIOmarkets Trading App. Access competitive spreads, fast execution, and flexible leverage on live and demo accounts.
Trading is risky
Other US Events to Watch This Week
- Wednesday 18 November, 19:00 UTC: minutes of the Fed's October meeting, which may show how many officials support further hikes. This is the next key input for gold price analysis after the retail sales data.
- Thursday 19 November, 13:30 UTC: weekly initial jobless claims.
Further ahead, the US jobs report is due on Friday 4 December, the Fed rate decision on Wednesday 9 December and November inflation data on Thursday 10 December, all on the economic calendar.
Gold Price Outlook: What Could Change the Picture
Beyond Tuesday's data, these factors remain central to any gold price analysis in the days ahead:
- Inflation and the Fed: the size and timing of the December hike remain the main driver for gold in the near term.
- The dollar and bond yields: a pullback in either could ease pressure on gold.
- Oil and the Middle East: energy prices feed directly into inflation expectations.
- Central bank demand: central banks bought 321 tonnes of gold in the third quarter of 2026, which has supported longer-term demand.
Risks and Uncertainties
No gold price analysis can rule out sudden moves around major data. These are the main risks to keep in mind this week:
- Mixed results: headline and core retail sales can point in different directions, as they did in September, which can cause sharp moves in both directions before the market settles.
- Revisions: changes to earlier months can matter as much as the new figure and may change how the data is read.
- Fed messaging: the FOMC minutes and comments from Fed officials could shift rate expectations quickly, regardless of the retail sales result.
- Geopolitical and oil headlines: news from the Middle East can move oil and gold at any time, sometimes against the direction suggested by US data.
- Liquidity and spreads: spreads can widen around 13:30 UTC, and prices may jump past stop orders in fast markets.
- Leverage: trading gold CFDs with leverage magnifies both gains and losses.
The levels and scenarios in this article are reference points, not targets, and the market may not respect them.
Conclusion
This gold price analysis reflects market conditions on 16 November 2026. Gold is trading near a one-year low as markets widely expect a Fed rate hike in December, and Tuesday's US retail sales report is the next test for that view.
- Stronger-than-expected retail sales could add to the case for tighter policy and keep pressure on gold.
- Weaker-than-expected sales could ease some rate hike concerns and offer gold short-term support.
- On the 4-hour chart, 4,150 and 4,400 are the key resistance levels, with support at 3,700 and 3,500.
- The FOMC minutes on Wednesday could shape the market's reaction for the rest of the week.
If you want to see how gold reacts to economic news without risking real money, you can practise on a demo account.

FAQ
Risk disclaimer: CFDs are complex instruments and come with a high risk of losing money rapidly due to leverage. You should consider whether you understand how CFDs work and whether you can afford to take the high risk of losing your money. Never deposit more than you are prepared to lose. Professional client’s losses can exceed their deposit. Please see our risk warning policy and seek independent professional advice if you do not fully understand. This information is not directed or intended for distribution to or use by residents of certain countries/jurisdictions including, but not limited to, USA & Countries included in the OFAC sanction list. The Company holds the right to alter the aforementioned list of countries at its own discretion.
TIOmarkets offers an exclusively execution-only service. The views expressed are for information purposes only. None of the content provided constitutes any form of investment advice. The comments are made available purely for educational and marketing purposes and do NOT constitute advice or investment recommendation (and should not be considered as such) and do not in any way constitute an invitation to acquire any financial instrument or product. TIOmarkets and its affiliates and consultants are not liable for any damages that may be caused by individual comments or statements by TIOmarkets analysis and assumes no liability with respect to the completeness and correctness of the content presented. The investor is solely responsible for the risk of his/her investment decisions. The analyses and comments presented do not include any consideration of your personal investment objectives, financial circumstances, or needs. The content has not been prepared in accordance with any legal requirements for financial analysis and must, therefore, be viewed by the reader as marketing information. TIOmarkets prohibits duplication or publication without explicit approval.
Join us on social media


Authors BIO

An experienced financial analyst and educator with over 8 years of expertise covering gold, forex, and global financial markets. Ahmed specializes in blending price action analysis with macroeconomic data to accurately interpret market movements, providing readers with comprehensive educational insights into trading and the financial world.





