


US CPI Preview: Will Annual Inflation Rise to 3.9%?
BY Ahmed Osama
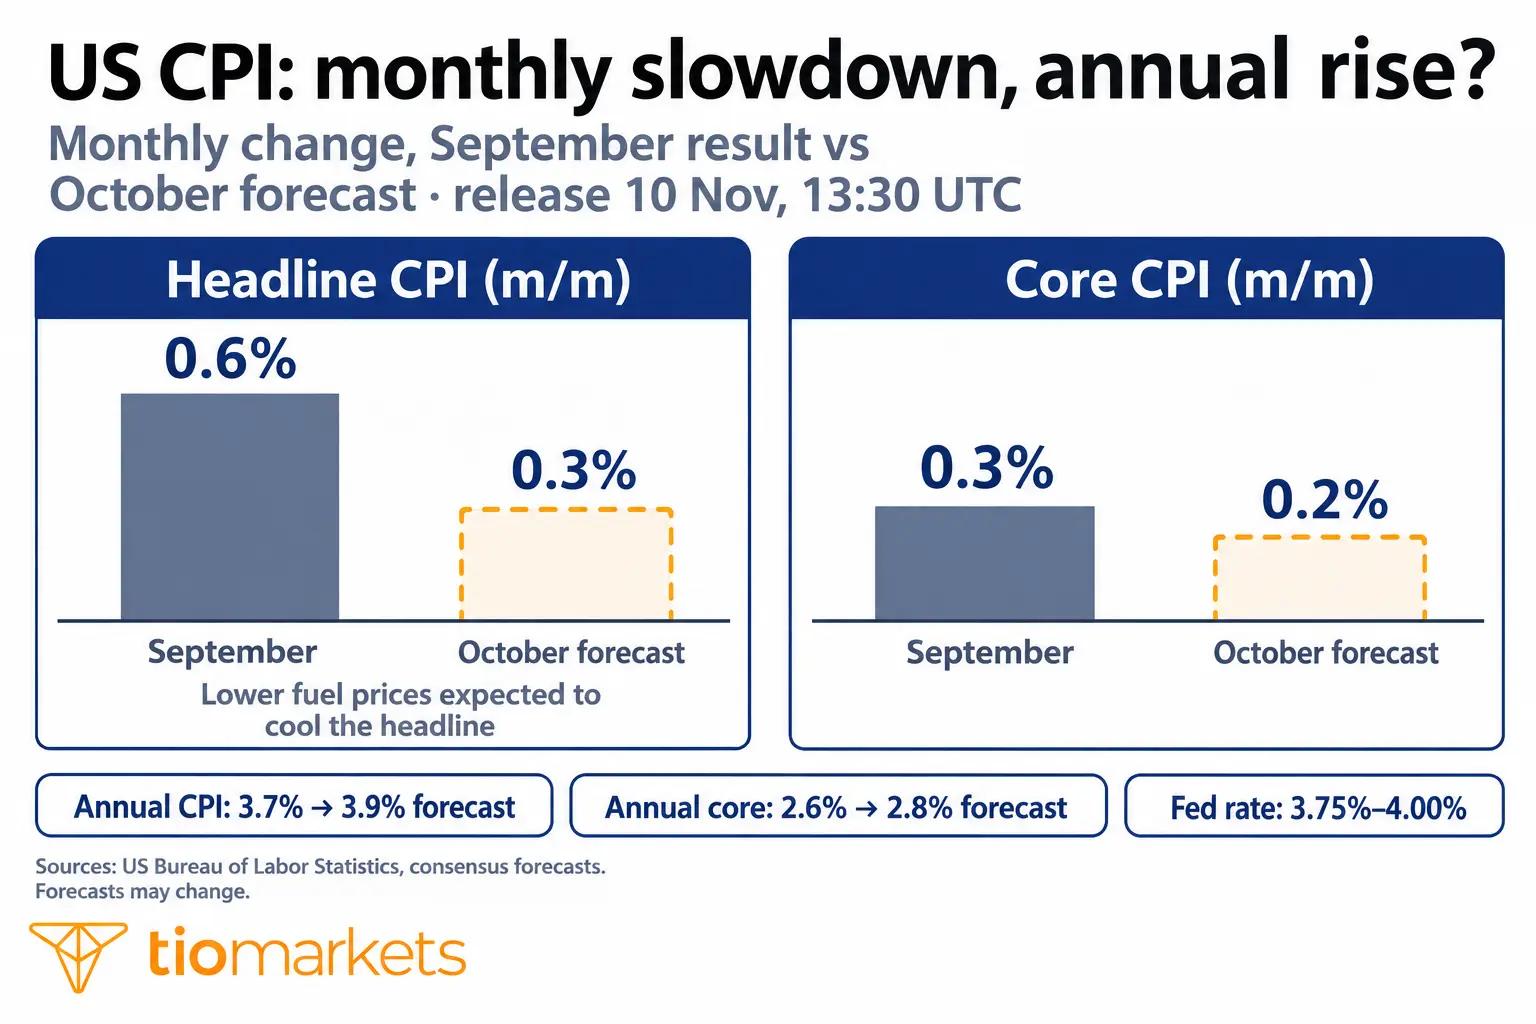
|November 9, 2026The US CPI report for October is due at 13:30 UTC on Tuesday 10 November. After consumer prices jumped 0.6% in September, lifting annual inflation to 3.7%, forecasts point to a slower monthly rise of 0.3%, with core CPI expected to rise 0.2%. Even so, annual inflation is forecast to edge up to 3.9%, and annual core inflation to 2.8%. Coming just days after a much stronger-than-expected jobs report, the US CPI data could decide how firmly markets expect the Federal Reserve to raise rates in December, and move the dollar, gold and EUR/USD.
US CPI report in brief
- The October US CPI report is due at 13:30 UTC on Tuesday 10 November.
- Forecasts point to a 0.3% monthly rise in headline CPI after 0.6% in September, and a 0.2% rise in core CPI after 0.3%. On an annual basis, headline inflation is forecast at 3.9% and core inflation at 2.8%.
- Annual inflation reached 3.7% in September, while annual core inflation was 2.6%.
- US employers added 165,000 jobs in October, far above forecasts of around 65,000, and the unemployment rate fell to 4.1%.
- Gold is trading back around the $4,100 area, while EUR/USD is moving in the lower half of its October range.
What is the US CPI report and when is it released?
The Consumer Price Index, or CPI, measures the average change in prices that US households pay for a basket of goods and services, from food and fuel to rent and healthcare. The US CPI report is published monthly by the Bureau of Labor Statistics and includes two key figures: headline CPI, which covers all items, and core CPI, which excludes food and energy because their prices move sharply from month to month. Our guide on how CPI is calculated explains the method in detail.
Because inflation is the main reason the Fed changes interest rates, the US CPI report is one of the most market-moving releases each month. The October CPI report is due at 13:30 UTC on Tuesday 10 November, as shown on our economic calendar.
What the forecasts show for the October CPI report
| Indicator | Forecast (October) | Previous (September) |
| Headline CPI, monthly | 0.3% | 0.6% |
| Core CPI, monthly | 0.2% | 0.3% |
| Headline CPI, annual | 3.9% | 3.7% |
| Core CPI, annual | 2.8% | 2.6% |
Forecasts vary by source and may change before the release.
In simple terms: forecasters expect monthly price increases to slow in October after September's large jump, mainly because fuel prices eased late in the month. But the annual rate is still forecast to edge up to 3.9%, which would keep inflation well above the Fed's 2% target. In other words, prices may be rising more slowly from month to month, but inflation is not yet falling.
Why this US CPI report matters for the Fed
The Fed raised its rate to 3.75%–4.00% in September and held it there on 28 October, with two officials voting for a further rise. Its next decision is due on 9 December. Our Fed interest rate decision preview explains the background.
The October jobs report strengthened the case for tighter policy. Employers added 165,000 jobs, nearly three times the forecast, and the unemployment rate fell to 4.1%. Our NFP preview covered the expectations before that release. After the data, markets widely expect a December rate rise.
That makes this US CPI report especially important. A higher-than-expected reading could reinforce expectations of a December rise, while a clear slowdown, especially in core inflation, could make the Fed more cautious.
How oil prices are feeding US inflation
Energy has been the main driver of headline inflation. Gasoline prices rose sharply over the summer and early autumn as oil climbed amid the conflict involving Iran, pushing headline CPI up 0.6% in September. Since late October, oil has fallen sharply on hopes of a diplomatic solution, with Brent dropping from near 118abarreltothemid-90s, which helped bring fuel prices down at the end of the month.
That is why many economists focus on core CPI. It strips out food and energy, so it shows whether price pressures are spreading to services such as rent, insurance and travel. The Fed can do little about oil prices, but a steady rise in core inflation would worry policymakers.
Four things to watch in the CPI report
1. Core CPI
The monthly change in core CPI is likely to matter more than the headline number. A rise of 0.3% or more would suggest underlying inflation is not easing.
2. Headline CPI and energy
A clear slowdown from 0.6% is expected because of lower fuel prices. A headline figure of 0.4% or more would suggest inflation pressure beyond energy.
3. Shelter and services
Rent and other service prices make up a large part of the index and change slowly, so they show whether inflation is becoming persistent.
4. Other data later in the week
US producer prices for October are due on Friday 13 November. Together with the CPI report, they will shape expectations for the Fed's December decision.
How the US CPI report could move gold
Gold tends to react to inflation data through its effect on US interest rate expectations and the dollar. Higher-than-expected inflation can lift expectations of higher rates, strengthening the dollar and weighing on gold, which pays no interest. Lower-than-expected inflation can have the opposite effect.
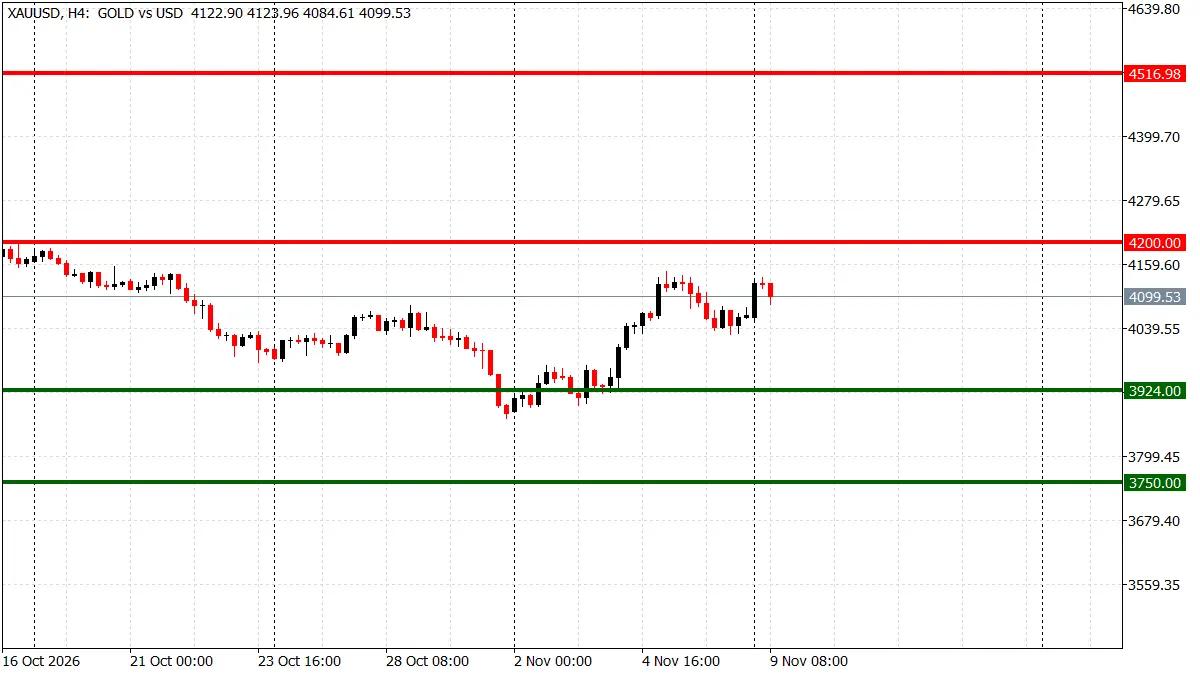
Gold traded mostly between $4,100 and $4,250 from late September to mid-October, then fell below $4,000 in late October, briefly dipping toward $3,890. It rebounded above $4,100 in early November before slipping after the strong jobs data, and has since been trading back around the $4,100 area.
Gold has been trading in a broad 3,750–4,300 range. Reference levels traders are watching:
- $4,300: the round-number resistance above the October highs
- $4,200: the top of the October range
- $3,900: the late-October low area
- $3,750: the next support area below
A higher-than-expected CPI reading could push gold back toward $3,900 and $3,750. A lower-than-expected reading could support gains toward $4,200 and $4,300.
How the US CPI report could move EUR/USD
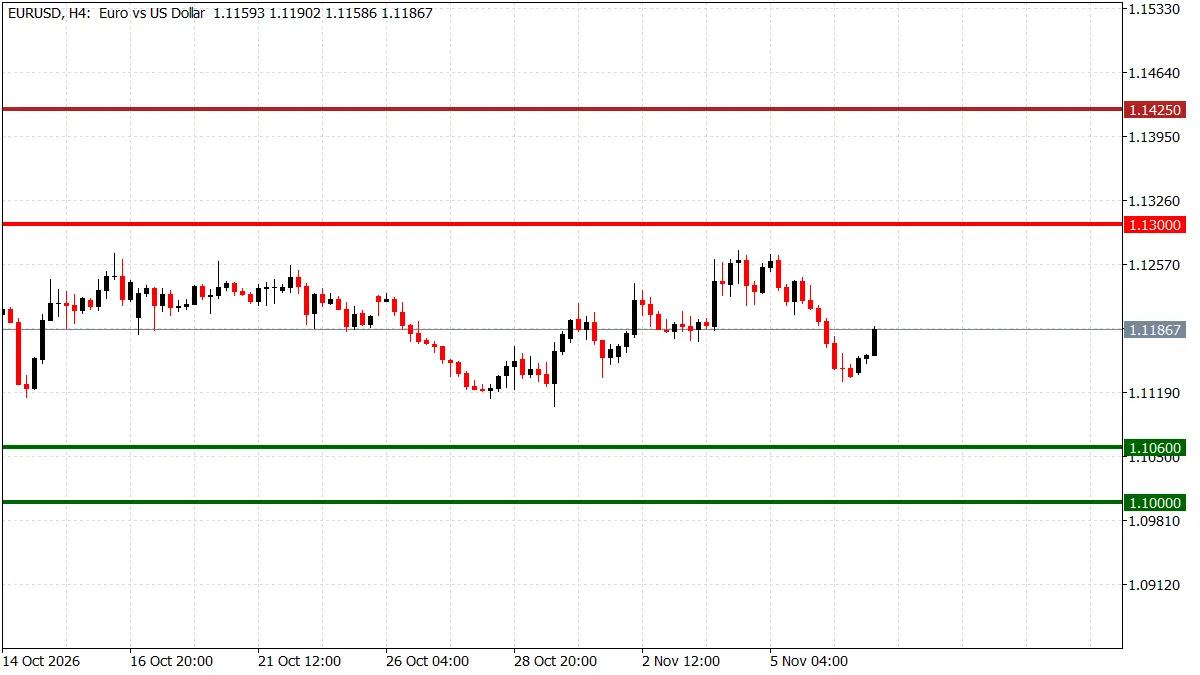
EUR/USD shows how many US dollars one euro buys, so a falling pair means a stronger dollar. The pair has traded mostly between 1.1100 and 1.1300 since early October. It rose toward the top of that range in early November, then fell back after the strong US jobs report and is now trading in the lower half of the range. The European Central Bank kept its deposit rate at 2.50% on 29 October, so US data have been a key driver of the pair. Our ECB rate decision preview covers the euro side.
EUR/USD has been trading in a broad 1.1000–1.1425 range. Reference levels traders are watching:
- 1.1425: the late-September resistance area
- 1.1300: the top of the October range
- 1.1060: the first support area below the October lows
- 1.1000: the round-number support area
A higher-than-expected CPI reading could lift the dollar and push EUR/USD toward 1.1060 and 1.1000. A lower-than-expected reading could lift the pair toward 1.1300 and possibly 1.1425.
All levels are context markers, not entry or exit points, and should be checked against a live price feed.
Trade Gold and EUR/USD with TIOmarkets
Take your position on major currencies and metals via CFDs. Enjoy tight spreads, fast execution, and fast, flexible funding options.
Trading is risky
Three scenarios: better than expected, as expected or worse than expected
In this table, "better than expected" means lower inflation than forecast, and "worse than expected" means higher inflation than forecast, from the perspective of consumers and the Fed's inflation goal. Higher-than-expected inflation tends to support the US dollar, which often means a lower gold price and a lower EUR/USD.
| Scenario | What it could look like | Possible market reaction | What could change the reading |
| Better than expected | Core CPI up 0.1% or less on the month, headline CPI up 0.2% or less, or annual inflation at 3.8% or lower | The dollar and US yields could fall as expectations of a December rate rise ease; gold could rise toward 4,200–4,300 and EUR/USD toward 1.1300–1.1425 | A large rise in shelter or other service prices within the report |
| As expected | Core CPI up about 0.2% and headline CPI up about 0.3% on the month, with annual inflation near 3.9% | First moves may be limited, with expectations of a December rise largely unchanged; gold could stay within 3,900–4,200 and EUR/USD within 1.1060–1.1300 | The details: services inflation and producer prices on Friday |
| Worse than expected | Core CPI up 0.3% or more on the month, headline CPI up 0.4% or more, or annual inflation at 4.0% or higher | The dollar and US yields could rise as expectations of a December rise strengthen; gold could fall toward 3,900–3,750 and EUR/USD toward 1.1060–1.1000 | A rise driven only by volatile items, such as airfares or used cars |
Scenario thresholds are editorial guideposts, not forecasts or trading recommendations.
A mixed report may create the hardest reaction
The most difficult outcome to read is a mixed one, for example a slower headline figure because of lower fuel prices, but a faster rise in core inflation. In that case, the first move in the dollar may reverse as traders focus on the core number. Liquidity can thin around 13:30 UTC, which can widen spreads and cause slippage.
Key events to watch
- Tuesday 10 November, 13:30 UTC: US CPI report for October
- Friday 13 November, 13:30 UTC: US producer prices for October
- Friday 4 December, 13:30 UTC: US jobs report for November
- Wednesday 9 December: the Fed's rate decision
- Thursday 10 December, 13:30 UTC: US CPI report for November
Risks and uncertainties
Inflation data can be volatile from month to month, especially when energy prices are moving sharply. Oil remains highly sensitive to developments in the Middle East, and a sudden move in crude could change the inflation outlook, and with it the Fed's view. Other data, including producer prices later in the week and the November jobs report, can quickly outweigh the market's first reaction to the CPI report.
Market direction is not mechanical. Positioning, liquidity and global risk sentiment can outweigh the usual relationship between inflation data and individual assets, and prices can gap or reverse rapidly around the release.
Conclusion
The October US CPI report is expected to show slower monthly inflation after September's 0.6% jump, mainly because of lower fuel prices, with core CPI forecast to rise 0.2%, while annual inflation is forecast to edge up to 3.9%. After a strong jobs report, the inflation data may decide how firmly markets expect a December rate rise. A higher-than-expected reading could support the dollar and weigh on gold and EUR/USD, while a lower-than-expected one could do the opposite. Core inflation is likely to matter more than the headline figure.

FAQ
Risk disclaimer: CFDs are complex instruments and come with a high risk of losing money rapidly due to leverage. You should consider whether you understand how CFDs work and whether you can afford to take the high risk of losing your money. Never deposit more than you are prepared to lose. Professional client’s losses can exceed their deposit. Please see our risk warning policy and seek independent professional advice if you do not fully understand. This information is not directed or intended for distribution to or use by residents of certain countries/jurisdictions including, but not limited to, USA & Countries included in the OFAC sanction list. The Company holds the right to alter the aforementioned list of countries at its own discretion.
TIOmarkets offers an exclusively execution-only service. The views expressed are for information purposes only. None of the content provided constitutes any form of investment advice. The comments are made available purely for educational and marketing purposes and do NOT constitute advice or investment recommendation (and should not be considered as such) and do not in any way constitute an invitation to acquire any financial instrument or product. TIOmarkets and its affiliates and consultants are not liable for any damages that may be caused by individual comments or statements by TIOmarkets analysis and assumes no liability with respect to the completeness and correctness of the content presented. The investor is solely responsible for the risk of his/her investment decisions. The analyses and comments presented do not include any consideration of your personal investment objectives, financial circumstances, or needs. The content has not been prepared in accordance with any legal requirements for financial analysis and must, therefore, be viewed by the reader as marketing information. TIOmarkets prohibits duplication or publication without explicit approval.
Join us on social media


Authors BIO

An experienced financial analyst and educator with over 8 years of expertise covering gold, forex, and global financial markets. Ahmed specializes in blending price action analysis with macroeconomic data to accurately interpret market movements, providing readers with comprehensive educational insights into trading and the financial world.





