


Bullish Candlestick Patterns: Complete Guide for Traders
BY Maria K.
|September 9, 2026Bullish candlestick patterns are visual formations on price charts that indicate potential upward price movement. These Japanese candlestick patterns help traders identify possible buying opportunities by revealing shifts in market sentiment from bearish to bullish conditions.
This comprehensive guide covers the essential bullish candle formations that traders commonly analyze. The article explains how to read these patterns, identifies the ten most recognized formations, and discusses practical considerations for incorporating them into trading analysis.
What Are Bullish Candlestick Patterns?
Bullish candlestick patterns are specific arrangements of one or more candles that historically precede upward price movements. These candlestick chart patterns serve as visual representations of buying and selling activity during defined time periods.
Definition and Core Characteristics
Bullish reversal patterns typically form after a period of declining prices. They suggest that selling pressure may be weakening while buying interest potentially increases. These formations can consist of single candles, two-candle combinations, or three-candle sequences.
The patterns derive their names from their visual appearance on charts. Each formation has distinct characteristics that differentiate it from other bullish price action signals. Traders across various markets, including stocks, forex, and cryptocurrencies, commonly reference these patterns.
How They Signal Potential Price Movement
Bullish trading patterns may indicate that buyers are gaining strength relative to sellers. When certain formations appear after extended downtrends, they can suggest a possible shift in the supply-demand balance. The reliability of these signals tends to vary based on market conditions and timeframe.
Candlestick pattern effectiveness has mixed results based mostly on market conditions. Pattern recognition alone typically does not guarantee future price direction, and many traders combine these signals with additional analysis methods.
The Psychology Behind Bullish Patterns
The psychology embedded in bullish candlestick patterns reflects collective trader behavior and sentiment shifts. A pattern like the hammer, for example, shows that sellers initially drove prices lower during a session. Buyers then entered the market with sufficient force to push prices back toward the opening level.
This price action suggests a potential change in market psychology. What began as continued bearish pressure transformed into buying activity. Understanding this psychological element helps explain why certain formations have historically attracted trader attention.
How to Read Bullish Candlestick Patterns
Reading bullish candlestick patterns requires understanding the basic anatomy of individual candles and recognizing where specific formations typically appear. The skill involves interpreting price information encoded in each candle's structure.
Anatomy of a Candlestick
Each candlestick contains four primary price data points: open, high, low, and close. The body represents the range between opening and closing prices, while the wicks (or shadows) extend to show the high and low extremes.
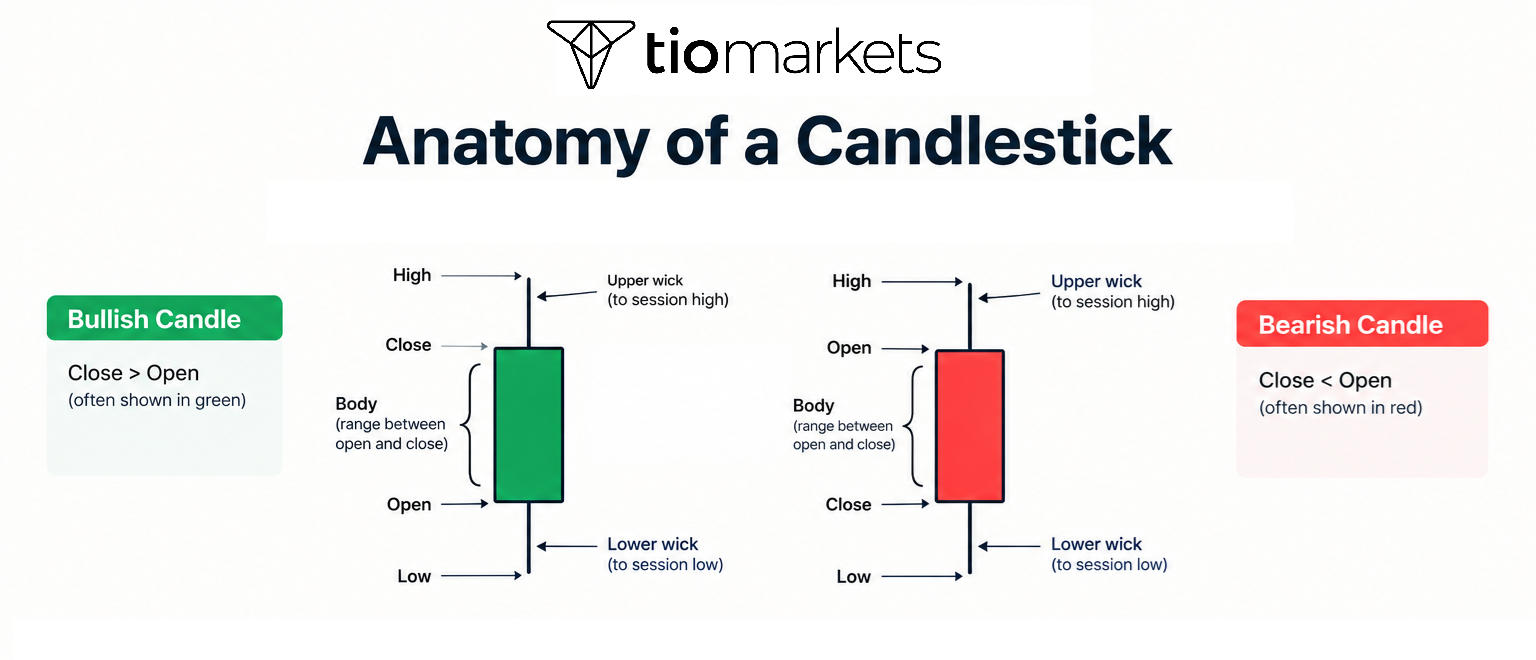
The upper wick extends from the body to the session high. The lower wick reaches from the body to the session low. A candle with no wicks opened at its low and closed at its high, or vice versa.
Body size indicates the strength of price movement between open and close. Large bodies suggest strong directional conviction, while small bodies may indicate uncertainty or consolidation.
Bullish vs. Bearish Candles Explained
Bullish candles close higher than they open, typically displayed in green or white depending on charting software. Bearish candles close lower than their opening price, usually shown in red or black.
The color distinction helps traders quickly assess whether buyers or sellers dominated during that time period. A series of bullish candles suggests sustained buying pressure over multiple sessions.
Understanding this basic distinction forms the foundation for recognizing more complex bullish candle formations. Many patterns incorporate both bullish and bearish candles in specific arrangements.
Where Bullish Patterns Typically Appear
Bullish reversal patterns tend to carry more significance when they form at the end of established downtrends. Support levels, previous consolidation zones, and areas of historical buying interest provide common contexts.
Patterns appearing in the middle of uptrends may signal continuation rather than reversal. The location context influences how many traders interpret a particular formation.
Technical analysts often note that patterns forming at key price levels may carry more weight than identical formations in random chart locations. This contextual awareness represents an important aspect of pattern analysis.
Top 10 Bullish Candlestick Patterns Traders Should Know
The following ten patterns represent some of the most commonly discussed bullish formations in technical analysis literature. Each pattern has distinct identification criteria and historical associations with potential price increases.
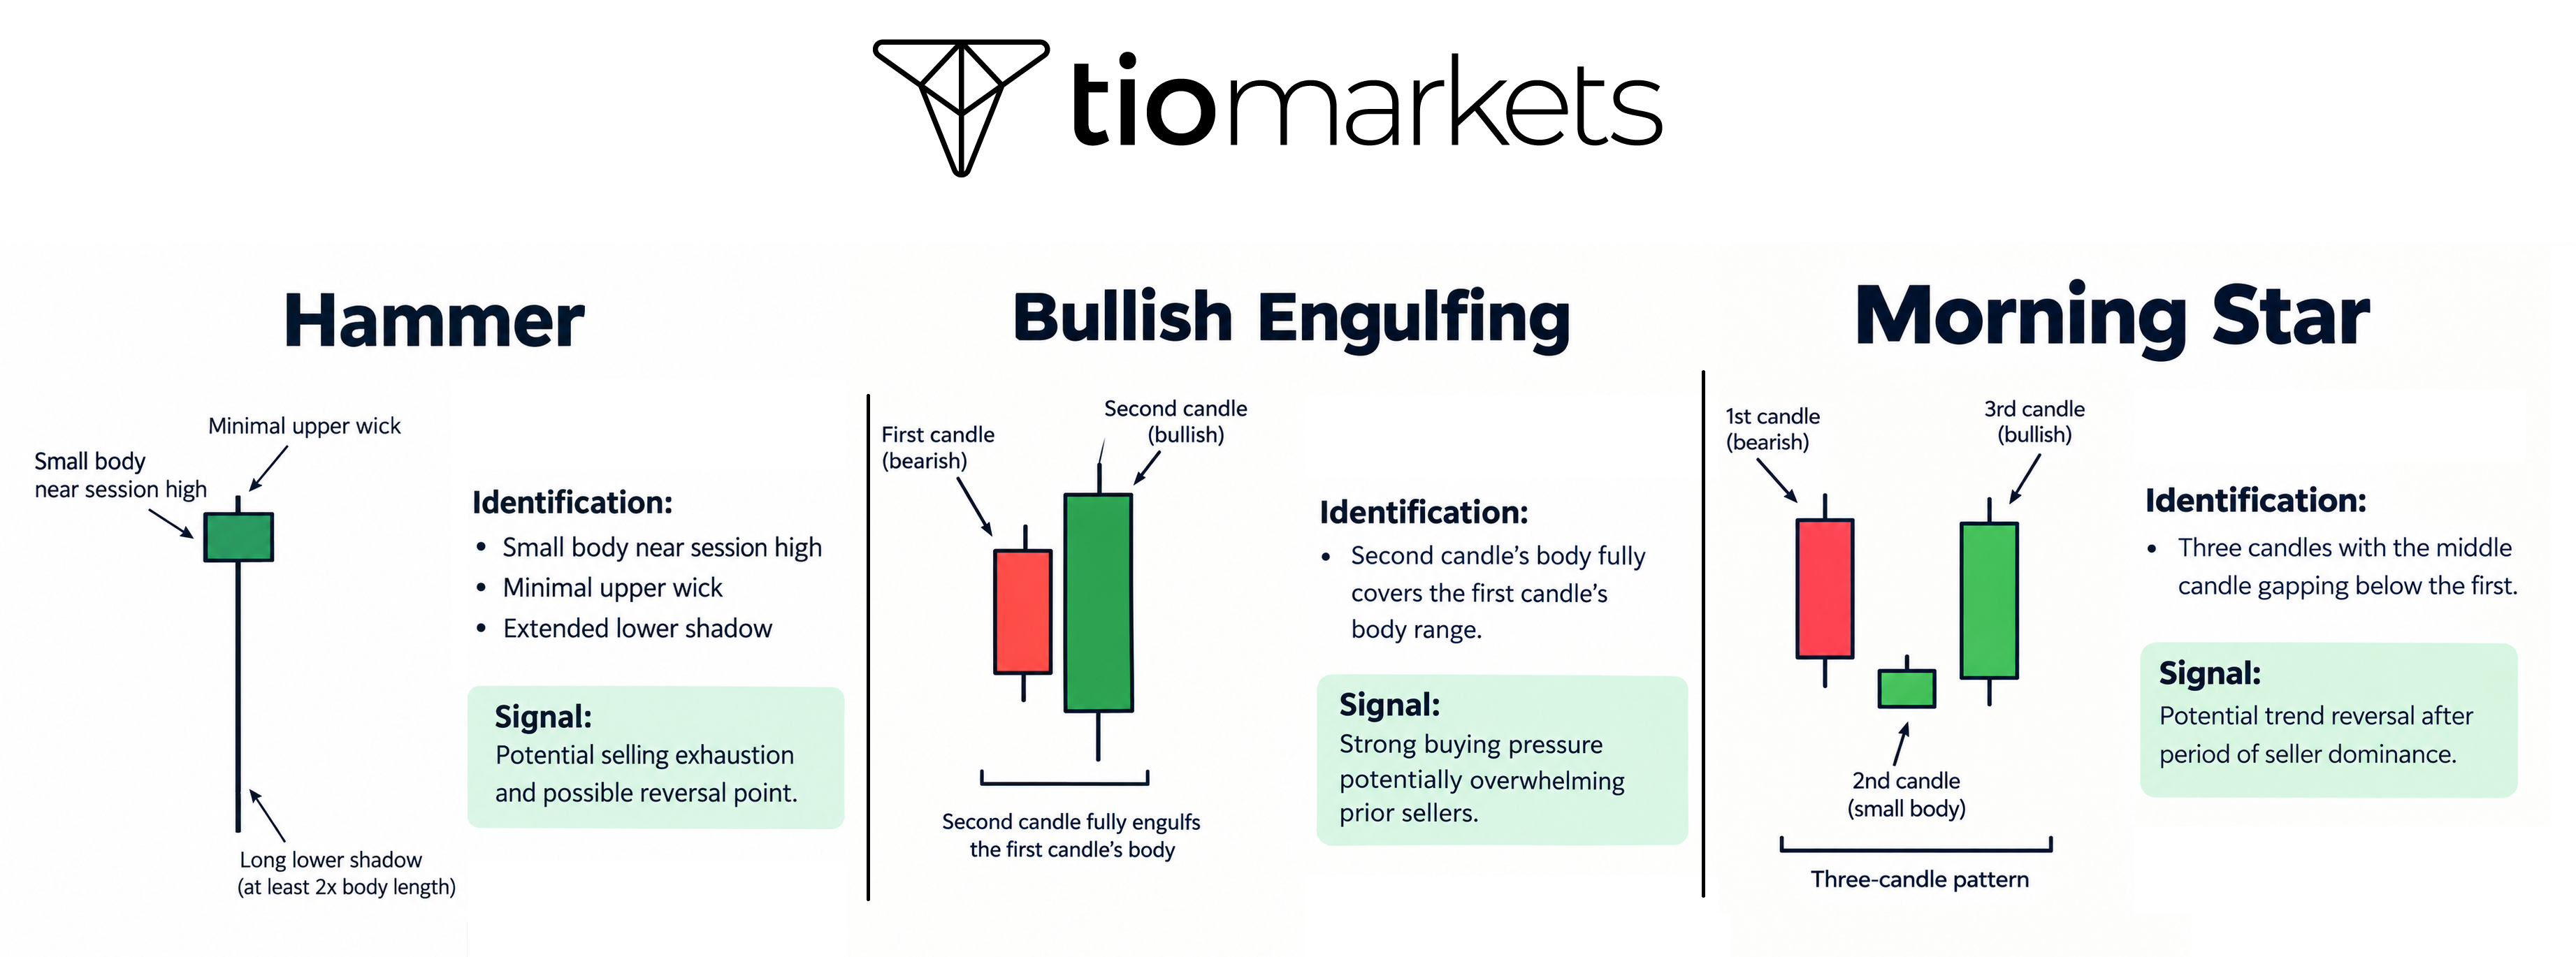
1. Hammer
The hammer features a small body at the top of the candle with a long lower wick at least twice the body length. It appears during downtrends and suggests buyers absorbed selling pressure.
Identification: Small body near session high, minimal upper wick, extended lower shadow.
Signal: Potential selling exhaustion and possible reversal point.
2. Bullish Engulfing
This two-candle pattern occurs when a bullish candle completely engulfs the previous bearish candle's body. The formation suggests a significant shift from selling to buying dominance.
Identification: Second candle's body fully covers the first candle's body range.
Signal: Strong buying pressure potentially overwhelming prior sellers.
3. Morning Star
The morning star is a three-candle pattern featuring a bearish candle, followed by a small-bodied candle, then a bullish candle. It suggests a transition from bearish to bullish sentiment.
Identification: Three candles with the middle candle gapping below the first.
Signal: Potential trend reversal after period of seller dominance.
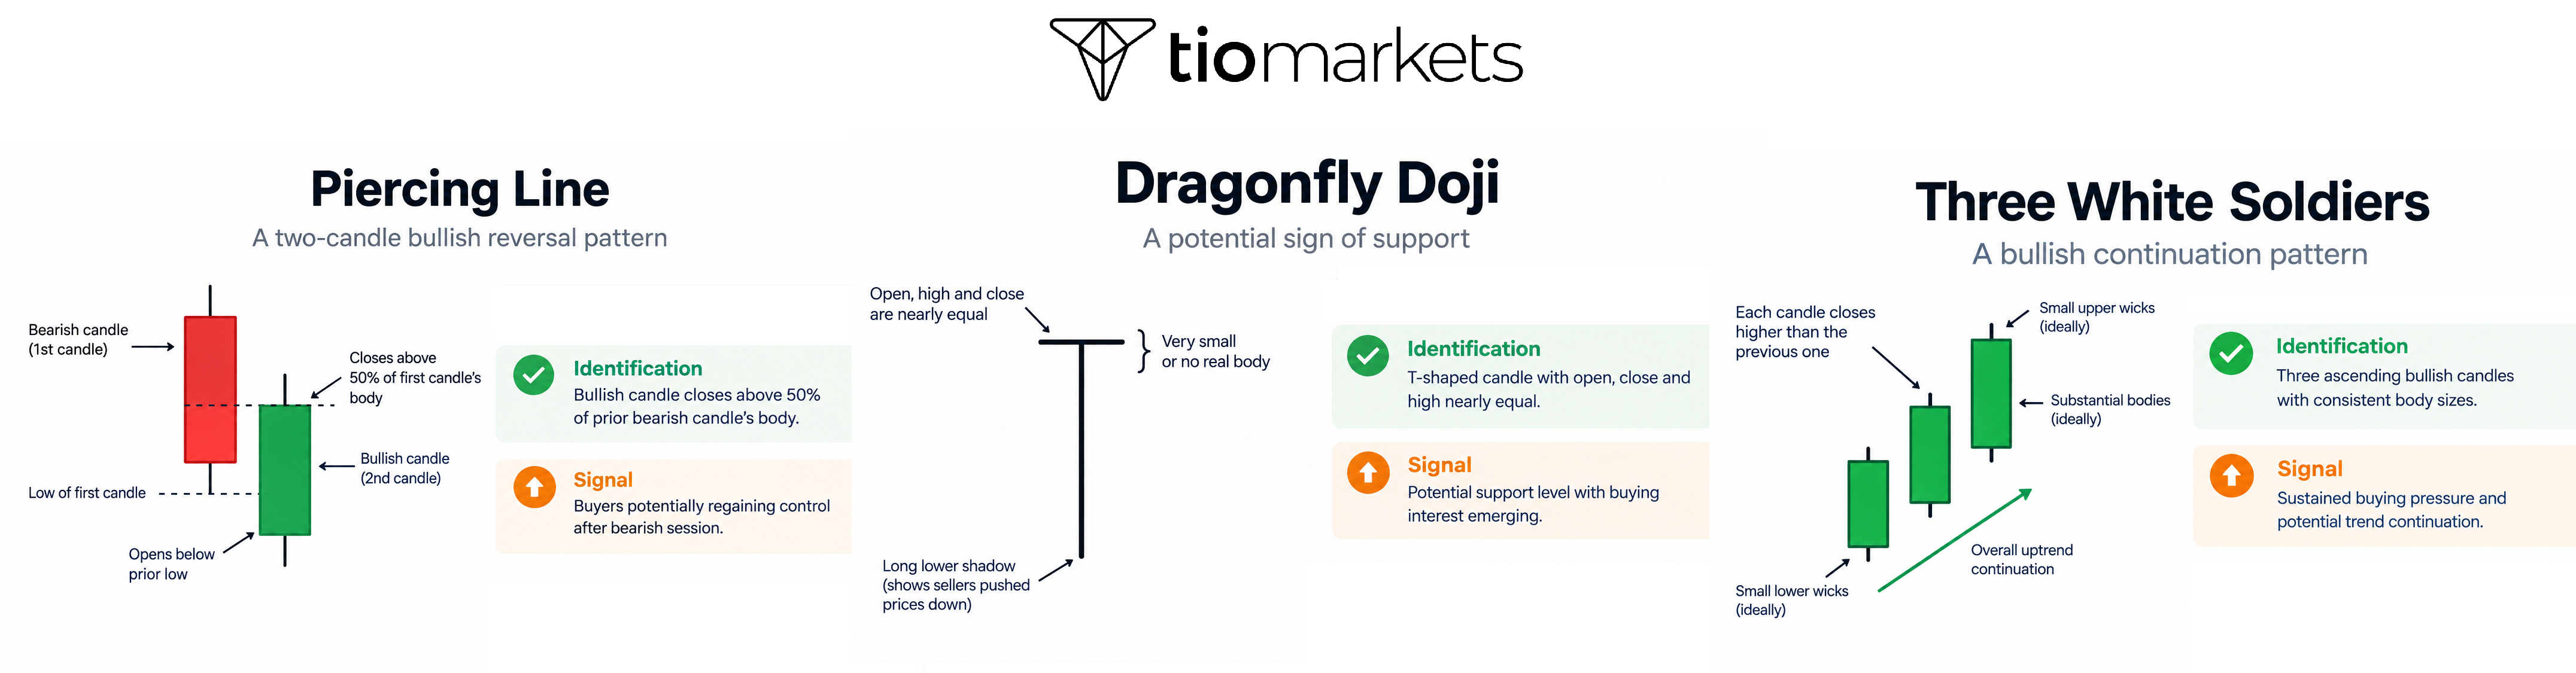
4. Piercing Line
This two-candle pattern shows a bearish candle followed by a bullish candle that opens below the prior low and closes above the midpoint of the first candle's body.
Identification: Bullish candle closes above 50% of prior bearish candle's body.
Signal: Buyers potentially regaining control after bearish session.
5. Dragonfly Doji
The dragonfly doji appears as a candle where open, high, and close occur at approximately the same level. The long lower shadow indicates sellers pushed prices down before buyers recovered.
Identification: T-shaped candle with open, close, and high nearly equal.
Signal: Potential support level with buying interest emerging.
6. Three White Soldiers
Three consecutive bullish candles, each closing higher than the previous, form this continuation pattern. The candles typically have small wicks and substantial bodies.
Identification: Three ascending bullish candles with consistent body sizes.
Signal: Sustained buying pressure and potential trend continuation.
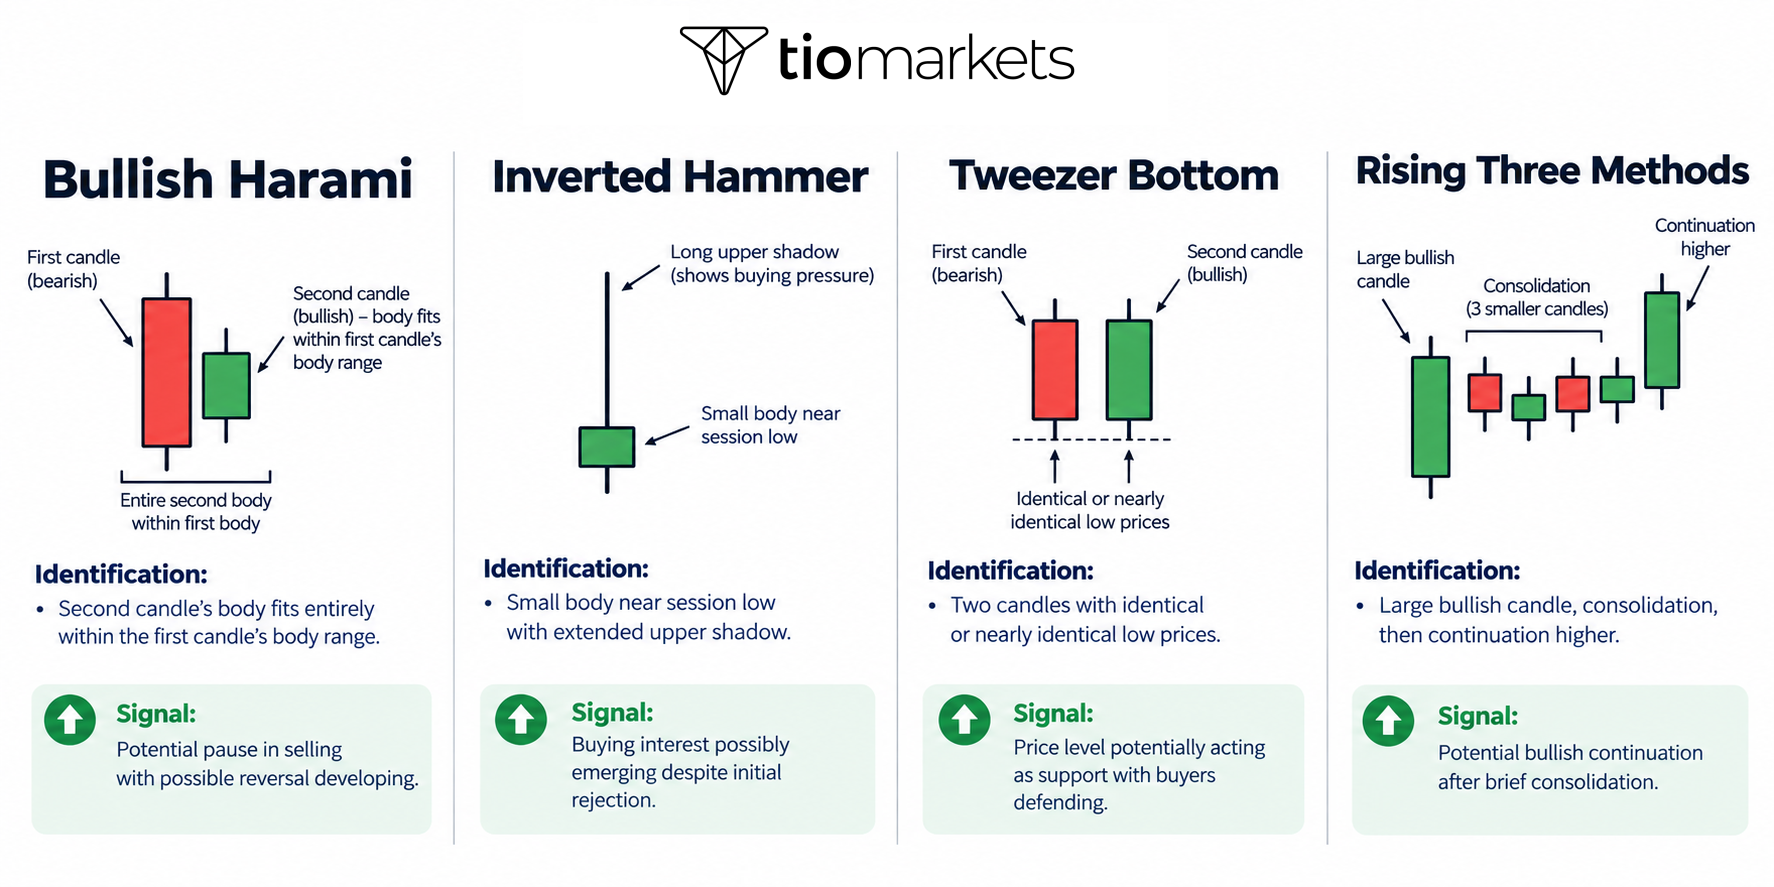
7. Bullish Harami
A large bearish candle followed by a smaller bullish candle contained within the first candle's body creates this formation. The pattern suggests momentum may be slowing.
Identification: The second candle's body fits entirely within the first candle's body range.
Signal: Potential pause in selling with possible reversal developing.
8. Inverted Hammer
The inverted hammer shows a small body at the bottom with a long upper wick. It appears during downtrends and suggests buyers attempted to push prices higher.
Identification: Small body near session low with extended upper shadow.
Signal: Buying interest possibly emerging despite initial rejection.
9. Tweezer Bottom
Two consecutive candles with matching lows, typically one bearish followed by one bullish, create this pattern. The equal lows suggest a potential support level.
Identification: Two candles with identical or nearly identical low prices.
Signal: Price level potentially acting as support with buyers defending.
10. Rising Three Methods
This five-candle continuation pattern features a large bullish candle, three small bearish candles within its range, and another large bullish candle. It suggests a pause rather than reversal.
Identification: Large bullish candle, consolidation, then continuation higher.
Signal: Potential bullish continuation after brief consolidation.
How to Use Bullish Candlestick Patterns in Trading
Effective use of bullish candlestick patterns typically involves combining pattern recognition with additional confirmation methods and risk management practices. Relying solely on pattern appearance without context may lead to inconsistent results.
Confirmation with Volume
Volume analysis can provide additional context for evaluating candlestick patterns. Bullish patterns accompanied by increasing volume may suggest stronger conviction behind the price movement.
A hammer forming on above-average volume, for example, indicates more participants were involved in that session's price action. Low-volume patterns might carry less significance due to reduced participation.
Many technical analysts consider volume confirmation an important filter for pattern validity. However, volume interpretation itself involves subjective elements and varies across different markets.
Combining with Other Technical Indicators
Technical traders often use candlestick patterns alongside other analysis tools. Moving averages, relative strength indicators, and support/resistance levels can provide additional context.
A bullish engulfing pattern appearing at a major support level while RSI shows oversold conditions might receive more attention than the same pattern in isolation. This confluence approach aims to identify higher-probability setups.
Trend indicators help determine whether patterns appear in appropriate market contexts. Bullish reversal patterns typically carry more significance during established downtrends approaching potential support zones.
Entry and Exit Considerations
Traders using candlestick patterns often wait for confirmation before acting. This might involve waiting for the next candle to close above the pattern high or waiting for a specific price level to be breached.
Exit strategies commonly reference nearby resistance levels, previous swing highs, or risk-reward ratios. Some practitioners use trailing stops that adjust as positions move favorably.
Position sizing based on distance to stop-loss levels represents a common risk management approach. This method attempts to normalize risk exposure across different setups.
Risk Management Considerations
Pattern failure occurs regularly, making risk management essential regardless of pattern quality. Stop-loss placement below pattern lows provides one common approach to limiting potential losses.
Traders typically determine acceptable risk levels before entering positions. This predetermined approach helps remove emotional decision-making from the process.
Risk-reward assessment involves comparing potential profit targets against potential loss levels. Many practitioners seek setups where potential reward exceeds risk by specified ratios.
Confirmation Methods by Pattern
| Pattern Type | Primary Confirmation | Secondary Confirmation |
| Single-candle (Hammer, Doji) | Next candle closes above pattern high | Volume spike on pattern candle |
| Two-candle (Engulfing, Piercing) | Volume increase on second candle | RSI showing oversold conditions |
| Three-candle (Morning Star) | Third candle closes strongly | Pattern forms at support level |
| Continuation (Three White Soldiers) | Steady or increasing volume | Trend alignment on higher timeframe |
Real-world Examples of Bullish Patterns
The hammer pattern appeared on the S&P 500 daily chart on October 13, 2022, near the 3,500 level. This formation preceded a multi-week rally, though traders who acted without confirmation initially saw drawdowns before the reversal materialized.
S&P 500 in October 2022
The October 13, 2022 session is widely recognized as a historic capitulation and reversal day for the S&P 500 (SPX) during the 2022 bear market. On that morning, a hotter-than-expected Consumer Price Index (CPI) report initially caused the index to gap down sharply, hitting an intraday low of 3,491.58, right at the crucial 3,500 psychological support level.
However, aggressive buying stepped in immediately after the open. The index staged a massive intraday turnaround, erasing a 2.3% deficit to close up 2.6% at 3,669.91. This extreme price action formed a textbook hammer candlestick pattern, characterized by a long lower shadow (wick) and a small real body near the top of the daily range, signaling strong rejection of lower prices.
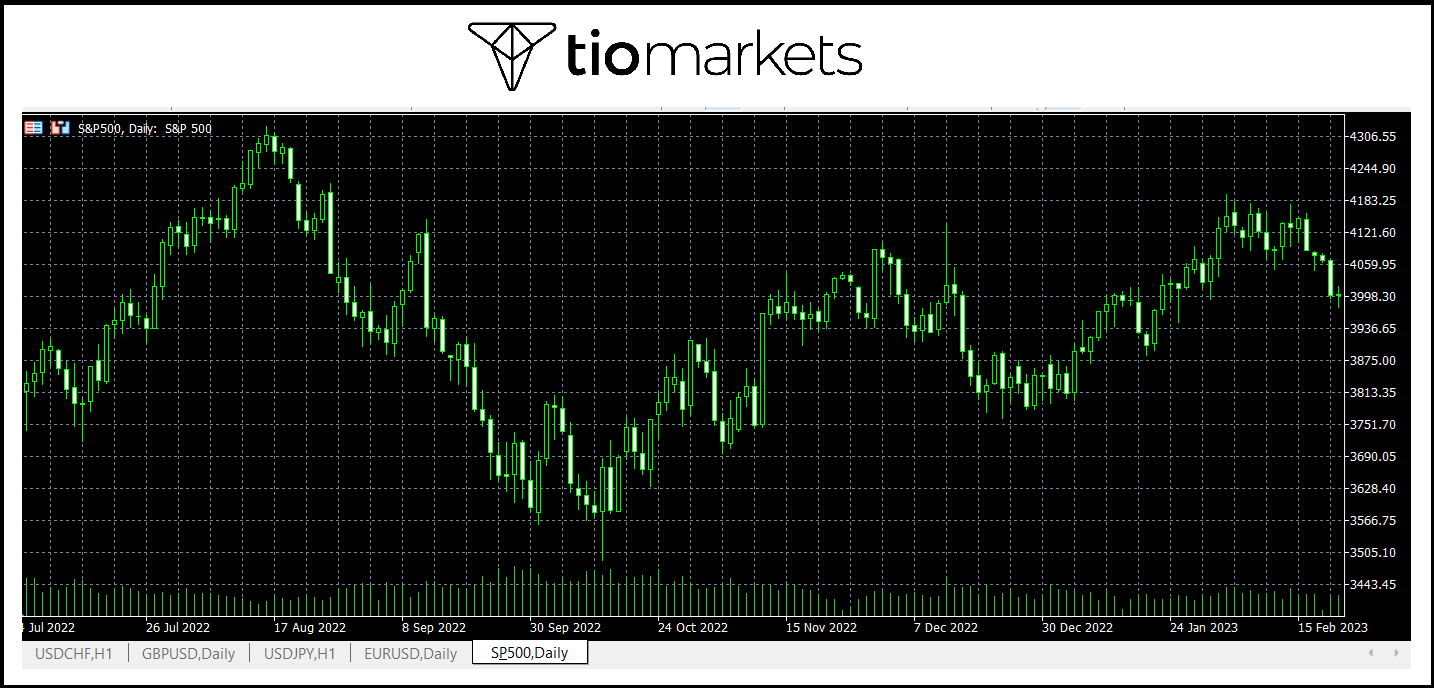
While the pattern perfectly marked the exact generational bottom of that bear market, the immediate aftermath highlights why risk management and wait-for-confirmation strategies are vital.
Common Mistakes to Avoid When Trading Bullish Patterns
Several common errors can reduce the effectiveness of candlestick pattern analysis. Awareness of these pitfalls may help traders develop more disciplined approaches.
Trading Without Confirmation
Acting immediately upon pattern appearance without waiting for confirmation represents a frequent error. Patterns can fail, and premature entries may result in unnecessary losses. Confirmation methods vary among practitioners but often involve waiting for additional price action or indicator alignment. This patience may result in slightly worse entry prices but potentially higher-quality setups.
Ignoring Overall Market Trend
Trading bullish reversal patterns during strong downtrends without considering broader context can prove problematic. The prevailing trend often exerts significant influence on individual pattern outcomes. Counter-trend patterns typically have lower success rates than trend-following patterns. Understanding the dominant market direction provides important context for pattern interpretation.
Over-Relying on Single Patterns
Treating any single pattern as a guaranteed trading signal ignores the probabilistic nature of technical analysis. No pattern works every time, and historical associations do not guarantee future outcomes. Combining multiple analysis methods and maintaining realistic expectations about pattern reliability may lead to more sustainable approaches. Patterns represent one tool among many available to traders.
Quick Checklist Before Trading a Bullish Pattern
| Step | Check | Pass/Fail |
| 1 | Pattern forms after established downtrend or pullback | ☐ |
| 2 | Pattern appears at support level or key price zone | ☐ |
| 3 | Volume supports the pattern (above average preferred) | ☐ |
| 4 | Pattern matches textbook criteria for identification | ☐ |
| 5 | Confirmation candle or signal present | ☐ |
| 6 | Risk-reward ratio acceptable (typically 1:2 or better) | ☐ |
| 7 | Stop-loss level identified below pattern low | ☐ |
| 8 | Position size calculated based on risk tolerance | ☐ |
| 9 | Broader market trend considered | ☐ |
| 10 | No conflicting signals from other indicators | ☐ |
Conclusion
Bullish candlestick patterns provide a visual framework for analyzing potential buying opportunities in financial markets. The formations discussed, including hammers, bullish engulfing patterns, and morning stars, represent commonly referenced patterns in technical analysis.
Effective pattern analysis typically involves combining candlestick recognition with volume analysis, additional technical indicators, and sound risk management practices. Understanding both pattern mechanics and their limitations helps develop realistic expectations.
Practice with historical charts and paper trading can help develop pattern recognition skills before applying these concepts with actual capital. Continuous learning and refinement of analysis methods represents an ongoing process for most market participants.

FAQ
Risk disclaimer: CFDs are complex instruments and come with a high risk of losing money rapidly due to leverage. You should consider whether you understand how CFDs work and whether you can afford to take the high risk of losing your money. Never deposit more than you are prepared to lose. Professional client’s losses can exceed their deposit. Please see our risk warning policy and seek independent professional advice if you do not fully understand. This information is not directed or intended for distribution to or use by residents of certain countries/jurisdictions including, but not limited to, USA & Countries included in the OFAC sanction list. The Company holds the right to alter the aforementioned list of countries at its own discretion.
TIOmarkets offers an exclusively execution-only service. The views expressed are for information purposes only. None of the content provided constitutes any form of investment advice. The comments are made available purely for educational and marketing purposes and do NOT constitute advice or investment recommendation (and should not be considered as such) and do not in any way constitute an invitation to acquire any financial instrument or product. TIOmarkets and its affiliates and consultants are not liable for any damages that may be caused by individual comments or statements by TIOmarkets analysis and assumes no liability with respect to the completeness and correctness of the content presented. The investor is solely responsible for the risk of his/her investment decisions. The analyses and comments presented do not include any consideration of your personal investment objectives, financial circumstances, or needs. The content has not been prepared in accordance with any legal requirements for financial analysis and must, therefore, be viewed by the reader as marketing information. TIOmarkets prohibits duplication or publication without explicit approval.
Join us on social media



Authors BIO

Maria is a writer and content strategist with over 10 years of experience in the finance industry. She specializes in developing research-backed articles that help financial professionals navigate complex market topics with confidence. Her expertise spans forex, stocks, CFDs and global markets, creating insightful content that educates readers and supports informed decision-making.








