


Nasdaq 100 vs S&P 500: Key Differences
BY TIOmarkets
|November 10, 2026The Nasdaq 100 vs S&P 500 comparison sets two US benchmark stock indices against each other: the Nasdaq 100 tracks 100 of the largest non-financial companies listed on the Nasdaq Stock Market, weighted by modified market capitalisation, while the S&P 500 tracks eligible stocks on selected US exchanges, weighted by float-adjusted market capitalisation. Those construction rules, rather than a different set of markets, explain why the Nasdaq 100 tends to move further in both directions.
This article covers how each index selects and weights its members, how their sector make-up differs and why a single session can move them by different amounts. It is written for traders who follow or trade either index, and it uses the chip-led rebound of November 9, 2026 as the dated example before setting out the US releases scheduled next.
Nasdaq 100 vs S&P 500: Why the Two Indices Moved Differently This Week
Wall Street rebounded broadly on Monday, November 9, 2026, after an AI-driven sell-off the previous week. Chipmakers led: the SOXX semiconductor exchange-traded fund (ETF) rose 7%, falling oil prices added support and stocks were heading for their best session since April. During the session the Nasdaq 100 was up 3.1%, on course for its best day since August.
The S&P 500 also rose, despite a fall in Nvidia after a probe involving its chief executive; it was Nvidia's worst day relative to the S&P 500 since the DeepSeek episode, while the rest of the chip sector rallied. These were intraday moves in a single session, and past performance is not a reliable indicator of future results.
What Is the Difference Between Nasdaq 100 and S&P 500?
The Nasdaq 100 is defined first by where a company lists and what it does. It includes 100 of the largest domestic and international non-financial securities listed on the Nasdaq Stock Market, ranked by market capitalisation. Securities of financial companies, including investment companies, as classified under the Industry Classification Benchmark (ICB), are excluded. The index was launched on January 31, 1985 with a base value of 250.00, and its composition is reviewed once a year in December, an annual reconstitution.
How S&P 500 companies are selected follows a different logic. S&P Dow Jones Indices, which maintains the index, admits index-eligible stocks listed on selected US exchanges, subject to size, float, liquidity and tradability criteria. As of December 31, 2025, a company needed an unadjusted market capitalisation of USD 22.7 billion or greater and a float-adjusted market capitalisation of at least 50% of that minimum, and a financial viability screen also applies.
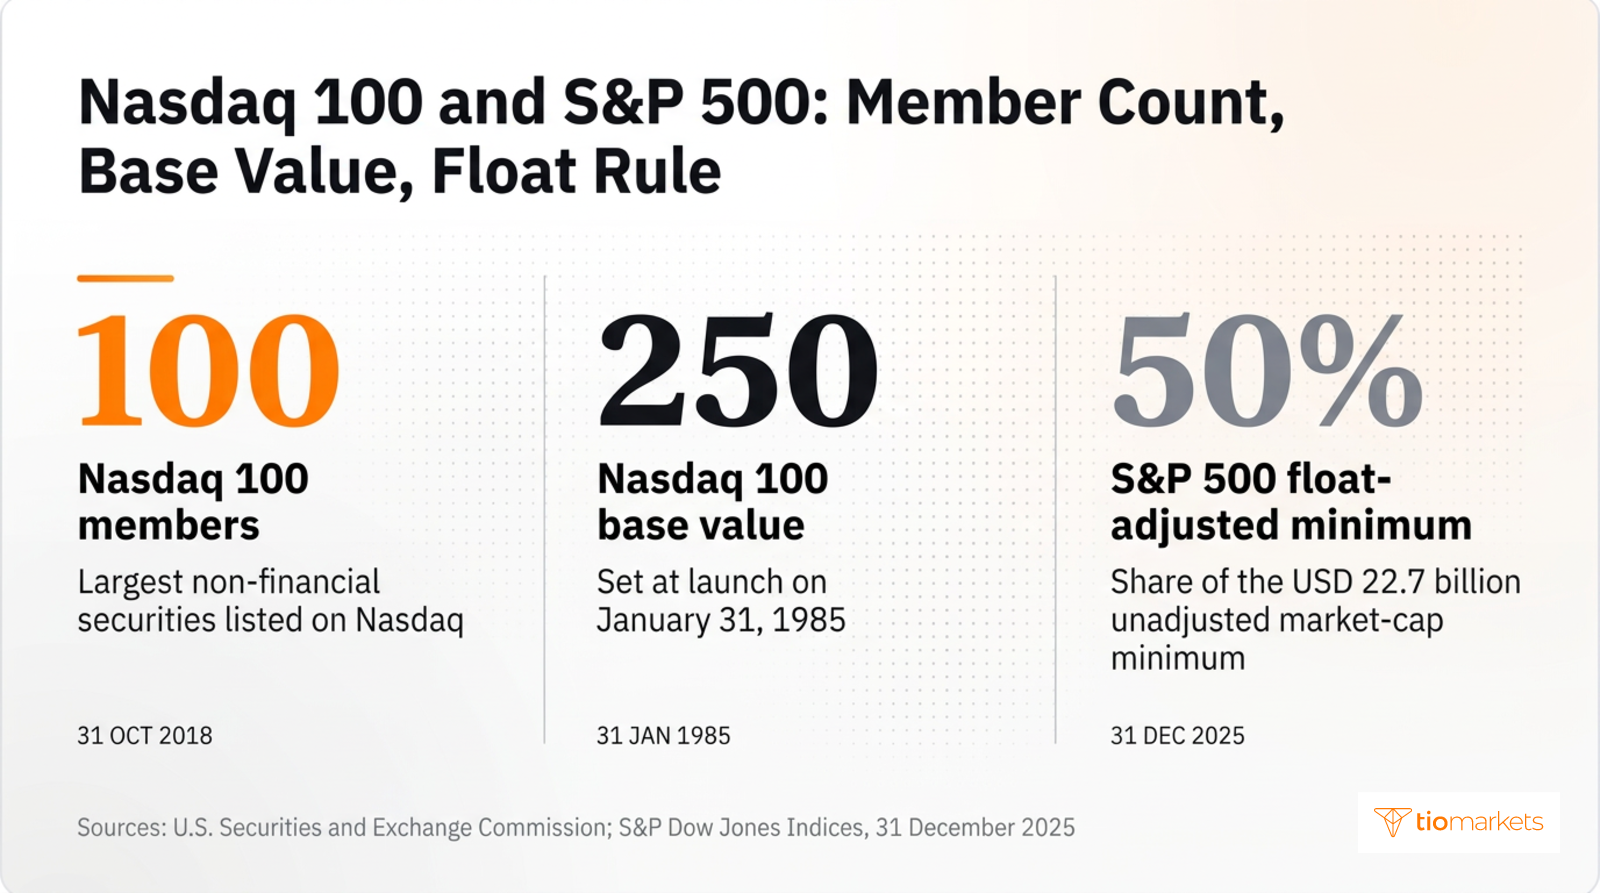
The Nasdaq 100 is therefore a narrower slice of the US market: one exchange, one sector excluded, and a membership that depends on where companies list. The S&P 500 filters on size, float and liquidity across exchanges and sectors.
| Feature | Nasdaq 100 | S&P 500 |
| Listing venue | The Nasdaq Stock Market only | Selected US exchanges |
| Membership | 100 of the largest non-financial securities by market capitalisation | Index-eligible stocks meeting size, float, liquidity and tradability criteria |
| Financial companies | Excluded, as classified under ICB | Eligible |
| Weighting | Modified market capitalisation | Float-adjusted market capitalisation |
| Size screen | Ranking by market capitalisation | Unadjusted market cap of USD 22.7 billion or greater (December 31, 2025) |
How Is the S&P 500 Weighted Compared With the Nasdaq 100?
Both indices start from market capitalisation weighting, in which a constituent's weight reflects the market value of its shares. The S&P 500 adds a free-float adjustment: only shares available to public investors count, and stakes that do not trade, such as large holdings by founders or governments, are left out.
How the Nasdaq 100 is weighted differs in one respect. Its modified market-cap weighting is a hybrid between equal weighting and conventional capitalisation weighting: the largest companies still carry the most weight, but the modification limits how far the biggest members can dominate the index.
The distinction bears on index concentration, the share of an index held by its few largest members. Under the S&P 500's float-adjusted weighting, a mega-cap company's weight rises with the market value of its freely traded shares, and S&P Dow Jones Indices announced on June 4, 2026, after a consultation on mega-cap companies, that its eligibility criteria would not change. In the Nasdaq 100, the modification reduces single-company concentration but not sector concentration, because the pool it draws from is itself weighted towards technology.
Sector Weights in the Nasdaq 100 and S&P 500
The Nasdaq 100 covers all major sectors except financials, so banks, insurers and investment companies are absent by rule. What remains reflects the Nasdaq listing base, in which megacap technology stocks and semiconductors carry a large share of the total, and other sectors are not represented in a proportion that offsets them.
The S&P 500 holds the same megacap technology stocks among its largest members, but their weight sits beside financial companies and other sectors whose earnings respond to different drivers, such as interest rates or commodity prices. A move confined to semiconductors therefore reaches the Nasdaq 100 through a larger combined weight. A move in bank shares, by contrast, registers in the S&P 500 and not at all in the Nasdaq 100.
Why Is the Nasdaq 100 More Volatile Than the S&P 500?
The Nasdaq 100's wider swings follow from that construction. With financials excluded and technology heavily represented, more of the index responds to the same drivers at once, so a sector move is amplified rather than diluted. Beta measures how far a stock or index has moved relative to a benchmark; a reading above 1 means larger moves in both directions. Early November 2026 showed both directions within a few sessions, as chip stocks fell sharply and then recovered.
Divergence in single sessions does not mean the two indices drift far apart over longer spans. The megacap technology stocks that meet both sets of rules carry heavy weight in each benchmark; when they move together, they pull both the same way, so the two can end a year close together after sessions in which they diverged widely. Any Nasdaq vs S&P 500 last 10 years chart reflects that overlap as well as the sector gap, and returns over any past period are history, not a reliable indicator of future results.
Index volatility matters directly to traders with leveraged positions, such as contracts for difference (CFDs) on the US100 or the US500. A CFD tracks the index price without ownership of the shares, and leverage allows a position larger than the deposit, or margin, that keeps it open. Because the Nasdaq 100 moves further, the same leverage produces wider swings on a US100 position than on a US500 one. Leverage magnifies losses as well as gains, losses can build quickly in sessions like those of early November 2026, and traders can lose all the money they deposit. The mechanics of trading stock indices through CFDs are the same for both benchmarks.
How Chip Stocks Move the Nasdaq 100: The Rebound Session as an Example
A sell-off in chip stocks earlier in the week gave the Nasdaq 100 its worst day since 2020 and pushed the Nasdaq Composite, a broader index of Nasdaq-listed stocks often confused with the Nasdaq 100, into correction territory. On Friday, November 6, 2026, chipmakers bounced and October payrolls came in well above estimates. The Nasdaq 100 rebounded about 2%, and the Composite rose 1.09% to close at 24,579.42.
Index construction sets the channels for a sector move, not its outcome. Semiconductors form a larger combined weight in the Nasdaq 100, so a broad chip rally such as that of November 9 lifts a bigger share of that index than of the S&P 500. A fall in one megacap chipmaker held in both benchmarks works against each of them, which is how the same session could combine a broad chip rally with a decline in Nvidia: the net effect on each index depended on how its weight was split between the wider chip group and that single stock. The moves of November 6 and 9 are a record of two sessions, and past performance is not a reliable indicator of future results.
What Is Scheduled Next: Inflation Data and Tech Earnings
Interest rates enter equity valuation through discounting: a company's present value reflects its expected future earnings, each reduced by a rate that represents the cost of money over time, and the further away an earnings stream lies, the more a change in that rate alters its present value. Economic data released around November 6 reinforced speculation that the Federal Reserve will raise interest rates in December, which places the inflation releases that follow among the information market participants assess.
The U.S. Bureau of Labor Statistics releases the Producer Price Index (PPI), which tracks prices at the producer level, for October 2026 on November 13, 2026 at 08:30 AM, and for November 2026 on December 15, 2026 at 08:30 AM. Its consumer-side counterpart, the Consumer Price Index (CPI), follows what urban households pay on average for a fixed basket of everyday goods and services, and how that cost shifts from one period to the next.
Earnings season, the period in which listed companies report quarterly results, is the other scheduled source of index moves. Results from megacap technology stocks bear on both benchmarks, while chipmakers' reports carry more weight in the Nasdaq 100. Reporting dates set when information arrives, not how either index responds.
Conclusion
The Nasdaq 100 and the S&P 500 share many of their largest companies, yet they are built to measure different things. The Nasdaq 100 tracks the largest non-financial companies on one exchange, with a weighting that trims single-stock dominance but leaves a heavy concentration in technology and semiconductors. That design channels a sector move such as the November 9, 2026 chip rally through a larger share of the index, while overlap in the largest shared constituents can keep the two benchmarks close over longer periods.
The comparison has limits. Index rules explain how sector moves pass through each benchmark, not when they occur, and sector weights shift with prices and reviews. A wider daily range means wider swings against a position: on a leveraged index position, losses are magnified as well as gains, can accumulate within one session and can take all the money a trader has deposited.
Trade S&P 500 and Nasdaq 100 with TIOmarkets
Take your position on global markets via CFDs. Enjoy tight spreads, fast execution, and fast, flexible funding options.
Trading is risky
FAQ
Risk disclaimer: CFDs are complex instruments and come with a high risk of losing money rapidly due to leverage. You should consider whether you understand how CFDs work and whether you can afford to take the high risk of losing your money. Never deposit more than you are prepared to lose. Professional client’s losses can exceed their deposit. Please see our risk warning policy and seek independent professional advice if you do not fully understand. This information is not directed or intended for distribution to or use by residents of certain countries/jurisdictions including, but not limited to, USA & Countries included in the OFAC sanction list. The Company holds the right to alter the aforementioned list of countries at its own discretion.
TIOmarkets offers an exclusively execution-only service. The views expressed are for information purposes only. None of the content provided constitutes any form of investment advice. The comments are made available purely for educational and marketing purposes and do NOT constitute advice or investment recommendation (and should not be considered as such) and do not in any way constitute an invitation to acquire any financial instrument or product. TIOmarkets and its affiliates and consultants are not liable for any damages that may be caused by individual comments or statements by TIOmarkets analysis and assumes no liability with respect to the completeness and correctness of the content presented. The investor is solely responsible for the risk of his/her investment decisions. The analyses and comments presented do not include any consideration of your personal investment objectives, financial circumstances, or needs. The content has not been prepared in accordance with any legal requirements for financial analysis and must, therefore, be viewed by the reader as marketing information. TIOmarkets prohibits duplication or publication without explicit approval.
Join us on social media


Authors BIO

Behind every blog post lies the combined experience of the people working at TIOmarkets. We are a team of dedicated industry professionals and financial markets enthusiasts committed to providing you with trading education and financial markets commentary. Our goal is to help empower you with the knowledge you need to trade in the markets effectively.





