


Risk Management in Trading: Core Concepts & Common Frameworks
BY Maria K.
|October 6, 2026Risk management in trading refers to the systematic process of controlling potential losses through position sizing, stop loss placement, daily loss limits, and drawdown protocols. These frameworks typically define how much capital is at risk on a single trade, on a single trading day, and during sustained losing periods before position size reduction is considered.
Trading education frequently describes risk management as the mathematical foundation that separates surviving traders from those who deplete their accounts. Many educators observe that even traders with profitable strategies may fail without proper trading risk control, while those with less refined strategies can potentially survive and improve through disciplined loss limitation strategies. The concepts explored in this article represent commonly discussed frameworks in trading education rather than personalised financial advice.
What Is Risk Management in Trading?
Risk management in trading is the systematic process of identifying, assessing, and controlling potential losses across all trading activities. In online trading, this discipline encompasses position sizing, stop loss placement, portfolio diversification, and capital preservation strategies.
Trading CFDs on forex, commodities, and indices carries inherent risks that every trader must understand before entering the markets. Online trading involves the potential for significant financial loss, and without proper risk management, even skilled traders can deplete their accounts.
What Are the Risks of Trading?
Online trading involves the potential for significant financial loss. Key risks include:
- Market risk: Prices can move against your position rapidly due to economic events, news releases, or market sentiment shifts
- Leverage risk: CFDs are leveraged products, meaning losses can exceed your initial deposit
- Liquidity risk: In volatile conditions, you may not be able to exit positions at your desired price
- Gap risk: Markets can open significantly higher or lower than the previous close, bypassing stop loss levels
- Emotional risk: Fear and greed can lead to impulsive decisions that deviate from your trading plan
- Concentration risk: Overexposure to a single instrument, sector, or market direction
How to Manage Each Risk
Effective risk management in trading combines multiple strategies to protect your capital:
| Type of Risk | Potential Risk Management Solution |
| Market risk | Use stop loss orders on every trade; limit exposure to correlated positions |
| Leverage risk | Trade smaller position sizes; use lower leverage ratios than the maximum offered |
| Liquidity risk | Avoid trading during low-volume periods; trade major currency pairs and popular instruments |
| Gap risk | Reduce position sizes before weekends and major news events; use guaranteed stop losses where available |
| Emotional risk | Follow a written trading plan; set daily loss limits; take breaks after consecutive losses |
| Concentration risk | Diversify across different instruments and markets; avoid overexposure to a single sector |
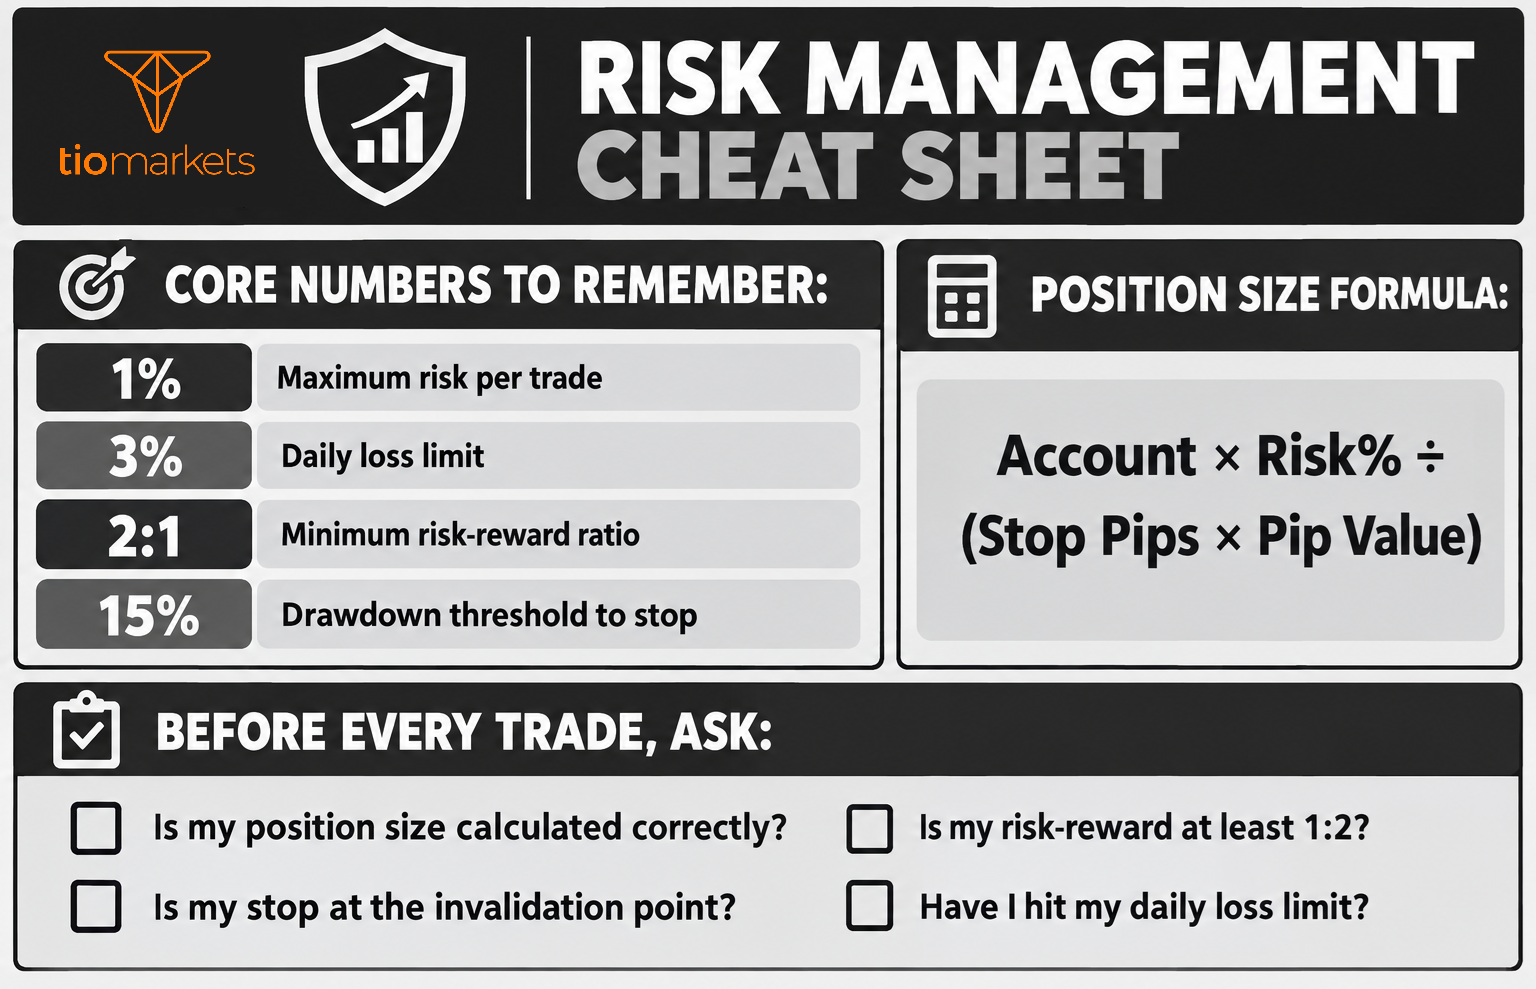
Beyond addressing specific risk types, most frameworks centre on one core principle: limiting risk per trade. Common guidelines suggest limiting risk to a small percentage of the total account on any single trade, often limiting risk to 1-2% per position - though this varies based on strategy, experience level, and market conditions.
Professional traders distinguish between trade risk (exposure on individual positions) and account risk (cumulative exposure across all open positions). A trader might limit individual trade risk to 1% while capping total account risk at 5%, preventing multiple correlated positions from creating excessive exposure.
Does Risk Management Matter More Than Trading Strategy?
Mathematical models demonstrate that a trader with a 48% win rate and 1% risk per trade can outperform a trader with a 65% win rate and 4% risk per trade over meaningful sample sizes. Risk management in trading is designed to help traders survive normal losing streaks, while strategy determines profit potential per winning trade.
Consider two hypothetical traders starting with $50,000 accounts. After ten trades with five wins and five losses, the outcomes differ substantially based on risk percentage:
| Risk Per Trade | Account After 10 Trades | Difference |
| 1% | $50,000 (approximate) | Baseline |
| 3% | $48,500 (approximate) | -$1,500 |
| 5% | $46,300 (approximate) | -$3,700 |
Losing streaks are statistically inevitable regardless of win rate. A trader with a 60% win rate still faces approximately a 10% probability of experiencing five consecutive losses. Oversized positions can create drawdowns that become mathematically difficult to recover from, which explains why professional trading desks are often reported to prioritise trading risk protocols alongside signal generation.
What Are the Four Layers of Trading Risk Management?
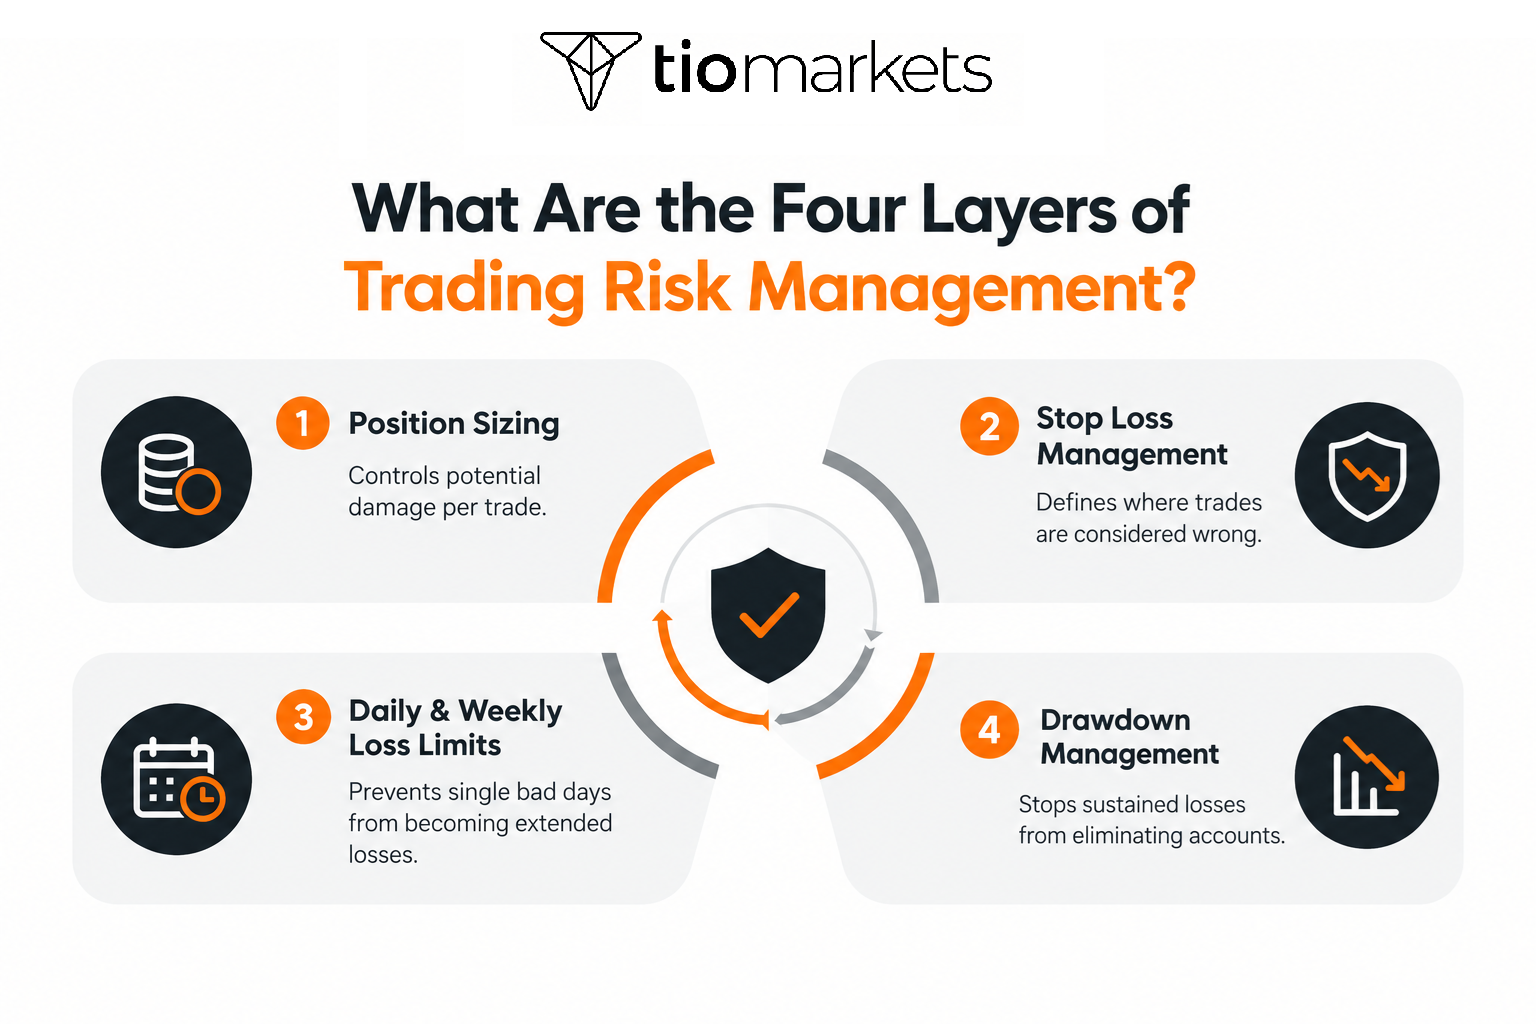
Common risk management frameworks describe four interconnected layers: position sizing (designed to control potential damage per trade), stop loss management (intended to define where trades are considered wrong), daily and weekly loss limits (structured to prevent single bad days from becoming extended losses), and drawdown management (aimed at preventing sustained losses from eliminating accounts).
1. How Does Position Sizing Control Risk Per Trade?
Position sizing calculations determine the exact number of units or contracts to trade based on the distance between entry price and stop loss. This approach is designed to ensure that maximum potential loss equals a fixed percentage of account value, with 1% commonly cited in trading education.
The formula frequently referenced is: Position Size = Account Risk ÷ (Stop Loss in Pips × Pip Value)
For a hypothetical $50,000 account risking 1% with different stop distances (assuming $10 pip value per standard lot on EUR/USD):
| Stop Distance | Position Size | Maximum Risk |
| 25 pips | 2.0 lots | $500 |
| 50 pips | 1.0 lot | $500 |
| 100 pips | 0.5 lots | $500 |
These position sizing strategies specify that position size adjusts to stop distance rather than trader conviction, maintaining consistent risk mitigation techniques across all trades.
How to Calculate Position Size for Every Trade?
In standard position sizing formulas, position size equals the maximum dollar risk per trade divided by the stop loss distance multiplied by the value per pip or point.
On a hypothetical 50,000 account risking 1% ($500), with a 50-pip stop on EUR/USD where pip value is $10 per standard lot, this calculates to $500 ÷ (50 × $10) = 1.0 standard lot. The step-by-step process involves three calculations:
- Determine account risk: $50,000 × 1% = $500
- Identify stop distance and pip value: 50-pip stop × $10 per pip = $500 risk per lot
- Calculate position size: $500 ÷ $500 = 1.0 standard lot
For a detailed walkthrough of a specific example, see this article on how to calculate lot size for EURUSD.
A common calculation error involves deciding lot size first, then placing the stop to fit. These formulas specify that stop location determines position size rather than trader conviction about a particular trade's potential.
What Risk Percentage Do Traders Use Per Trade?
The most commonly cited guideline in trading education is 1% of total account value per trade, though some experienced traders are reported to use up to 2%. Trading education materials frequently note that risking more than 2% per trade can create drawdowns that become mathematically difficult to recover from after normal losing streaks.
The impact of five consecutive losses at different risk levels illustrates this concept:
| Risk Level | Account After 5 Losses | Recovery Needed |
| 1% | $47,500 | 5.3% |
| 3% | $42,950 | 16.4% |
| 5% | $38,700 | 29.2% |
Some educators suggest beginners may consider starting at 0.5% for initial trades while developing their trade risk assessment skills. The compounding mathematics of consistent small risk create substantially different outcomes than inconsistent large risk over extended periods.
2. Where to Place Stop Loss Orders?
Stop loss placement represents a critical component of risk management in trading. In common frameworks, stop losses are typically placed at price levels where the trade thesis would be considered invalidated. For long positions, this often means below support levels; for short positions, above resistance. Volatility-based approaches may use 1.5-2x the Average True Range from entry.
Many risk frameworks specify that stops are placed at entry and not moved further away. The mathematical impact of moving stops can be significant: a planned $500 loss could become an $800 actual loss if the stop is widened. Risk-reward optimisation concepts suggest a minimum 2:1 ratio is frequently cited, meaning target profit equals twice the risk amount.
Practical Stop Loss Placement Process
Many traders follow this step-by-step approach for their trades:
- Identifying the trade setup: Determining the entry point and direction based on analysis
- Finding the invalidation level: Asking: "At what price is my trade idea proven wrong?"
- Adding a buffer: Placing the stop slightly beyond the invalidation level to account for spreads and minor price spikes
- Calculating the pip/point distance: Measuring the distance from entry to stop loss
- Determining position size: Using the distance to calculate appropriate lot size based on the risk percentage
- Evaluating risk-reward: Ensuring potential profit justifies the risk before entering
Stop Losses and Take Profits as Risk Management Tools
Stop loss and take profit orders are essential tools that automate your exit strategy and remove emotion from trading decisions.
Stop Loss Orders:
- Automatically close your position at a predetermined loss level
- Protect your account from catastrophic losses
- Allow you to define your maximum risk before entering a trade
- Commonly placed based on technical analysis, not arbitrary dollar amounts
Take Profit Orders:
- Automatically close your position when a target price is reached
- Lock in profits without requiring you to monitor the trade constantly
- Help maintain discipline by executing your planned exit
- Typically reflect realistic price targets based on market structure
Combining stop losses and take profits allows you to calculate your risk-reward ratio before entering any trade. For example, risking 50 pips to potentially gain 100 pips represents a 1:2 risk-reward ratio.
What Is a Risk-Reward Ratio and Why Does It Matter?
A risk-reward ratio compares potential profit to potential loss on a trade, representing a core element of portfolio risk management. A 2:1 ratio means the target profit is twice the risk amount; at this ratio, the mathematical break-even win rate is approximately 34% after accounting for costs.
Win rate requirements at different ratios:
| Risk-Reward Ratio | Break-Even Win Rate |
| 1:1 | 50% |
| 2:1 | 34% |
| 3:1 | 25% |
The 1:1 ratio is mathematically marginal even at 55% win rate once trading costs are included. However, pursuing higher ratios may reduce win rate as profit targets become more distant, representing a trade-off that individual traders evaluate differently.
Many traders only take trades offering at least 1:2 or 1:3 ratios, ensuring that winning trades more than compensate for losses over time. This selectivity means passing on setups that don't meet the minimum threshold, which requires patience and discipline.
3. How Do Daily and Weekly Loss Limits Protect Accounts?
Daily loss limits form another essential layer of risk management in trading. With 3% of account value commonly cited, these limits are designed to stop trading after a predetermined loss amount is reached. These limits aim to prevent the emotional cascade where traders may take increasingly large positions attempting to recover losses through what is often termed "revenge trading."
On a hypothetical $50,000 account, commonly discussed limits translate to:
- Daily limit: $1,500 (3%)
- Weekly limit: $2,500-3,000 (5-6%)
4. Drawdown Management and When to Reduce Size
One commonly discussed drawdown management approach uses three tiers based on decline from peak account value. Drawdown represents the percentage decline from highest account value to current value: a $55,000 peak falling to $49,500 represents a 10% drawdown.
The asymmetric recovery mathematics are significant: a 10% loss needs an 11.1% gain to recover, while a 25% loss requires a 33.3% gain. This mathematical reality underlies the three-tier framework often discussed:
| Tier | Drawdown Range | Common Response |
| 1 | 0-5% | Normal variance, no changes |
| 2 | 5-15% | Reduce size by 50%, diagnose causes |
| 3 | 15%+ | Cease trading, complete full review |
Prop firm considerations often require tighter personal limits since external drawdown limits may be more restrictive than personal risk tolerance.
Common Risk Management Mistakes
Understanding common mistakes is essential for effective risk management in trading. Five frequently discussed mistakes include varying risk based on trade conviction, operating without a daily loss limit, moving stops away from entry, ignoring correlated positions, and counting unrealised profit as available capital.
- Varying risk by conviction occurs when traders increase position size on trades they feel more confident about. This pattern may appear in trade data as inconsistent risk percentages ranging from 0.5% to 4% based on subjective assessments rather than systematic calculation.
- Operating without daily loss limits can create an account damage cascade where early losses trigger larger positions attempting recovery, leading to accelerated capital depletion during difficult sessions.
- Moving stops transform planned losses into larger actual losses. A $500 planned risk becoming an $800 realised loss represents a 60% increase in damage from a single behavioural decision.
- Correlated positions may disguise concentrated risk; three tech stock CFDs may function as one larger bet during sector-wide movements, creating portfolio-level risk that exceeds intended parameters.
- Counting unrealised P&L as capital represents the "phantom money" phenomenon where paper gains are treated as real, potentially leading to position sizing based on unrealised and reversible profits.
How Risk Management Fits Into a Complete Trading Plan?
Risk management in trading is often described as one of three essential components of a trading plan, alongside strategy rules (entry and exit criteria) and psychological controls (emotional discipline protocols). Risk rules are typically applied before trades (position sizing), during trades (stop management), and after trades (session and drawdown evaluation). The relationship between risk management and trading psychology is bidirectional: clear risk rules may reduce emotional decision-making, while emotional control supports consistent rule adherence.
Conclusion
Risk management in trading operates through four layers: position sizing, stop placement, daily limits, and drawdown protocols. The 1% rule and 3% daily limit represent frequently cited guidelines designed for capital preservation. These frameworks address survival across many trades, while strategy addresses profit potential. Implementation requires both mathematical calculation and behavioural discipline.
Key Takeaways on Risk Management in Trading
Core Principles
- Capital preservation: Commonly described as the foundation that allows traders to continue participating in markets
- The 1% rule: A frequently cited guideline that limits maximum loss to 1% of account value per trade
- Position sizing: A calculation method that determines the number of units based on stop-loss distance
- Risk-reward ratio: Many frameworks suggest targeting trades where potential profit is at least double the risk (2:1 or higher)
Essential Tools
- Stop-loss & take-profit orders: Automated orders that close positions at predetermined price levels, either to limit losses or secure gains
- Daily loss caps: A threshold, often cited as 3%, at which traders cease activity for the session
- Leverage control: Restricting leverage usage is commonly discussed as a method to prevent minor price fluctuations from significantly impacting margin
- Diversification: Spreading capital across non-correlated assets is often recommended to reduce sector or single-instrument exposure

FAQ
Risk disclaimer: CFDs are complex instruments and come with a high risk of losing money rapidly due to leverage. You should consider whether you understand how CFDs work and whether you can afford to take the high risk of losing your money. Never deposit more than you are prepared to lose. Professional client’s losses can exceed their deposit. Please see our risk warning policy and seek independent professional advice if you do not fully understand. This information is not directed or intended for distribution to or use by residents of certain countries/jurisdictions including, but not limited to, USA & Countries included in the OFAC sanction list. The Company holds the right to alter the aforementioned list of countries at its own discretion.
TIOmarkets offers an exclusively execution-only service. The views expressed are for information purposes only. None of the content provided constitutes any form of investment advice. The comments are made available purely for educational and marketing purposes and do NOT constitute advice or investment recommendation (and should not be considered as such) and do not in any way constitute an invitation to acquire any financial instrument or product. TIOmarkets and its affiliates and consultants are not liable for any damages that may be caused by individual comments or statements by TIOmarkets analysis and assumes no liability with respect to the completeness and correctness of the content presented. The investor is solely responsible for the risk of his/her investment decisions. The analyses and comments presented do not include any consideration of your personal investment objectives, financial circumstances, or needs. The content has not been prepared in accordance with any legal requirements for financial analysis and must, therefore, be viewed by the reader as marketing information. TIOmarkets prohibits duplication or publication without explicit approval.
Join us on social media



Authors BIO

Maria is a writer and content strategist with over 10 years of experience in the finance industry. She specializes in developing research-backed articles that help financial professionals navigate complex market topics with confidence. Her expertise spans forex, stocks, CFDs and global markets, creating insightful content that educates readers and supports informed decision-making.








