


Displacement Forex Trading Guide
BY Eleni Antoniou
|October 12, 2026Displacement in forex is a fast, decisive move in one direction, usually formed by one or more large-bodied candles with relatively small wicks. Traders who use price action and Smart Money Concepts (SMC) terminology watch for it because the move might break market structure and leave an imbalance known as a fair value gap.
A large candle does not prove that institutions caused the move, and displacement does not predict what price will do next. It is a way to describe the character of price movement. This guide explains how to identify displacement, measure it consistently and place it inside a risk-managed trading process.
What is displacement in forex trading?
The displacement forex concept describes a forceful repricing of a currency pair. Price covers more distance than it has in recent candles, closes strongly toward one end of its range and spends relatively little time moving back and forth.
On a chart, displacement often has four features:
- A candle body that is noticeably larger than nearby candle bodies.
- A close near the candle's high in a bullish move or near its low in a bearish move.
- A break through a meaningful swing high, swing low, support or resistance area.
- A fair value gap or another visible area of limited candle overlap.
Not every feature must appear for traders to use the label. There is no universal formula or official threshold for displacement forex analysis. What matters is that the move is exceptional relative to the same currency pair, timeframe and recent market conditions.
Why displacement matters to price action traders
Displacement helps traders assess how price crossed a level, not merely whether it crossed. A slow drift beyond a swing high and an explosive close through it both count as breaks on a basic chart, but they show different behaviour.
A decisive move may suggest that buying and selling interest became temporarily unbalanced. In SMC and ICT-style analysis, traders often use that information to:
- Give more weight to a break of structure or market structure shift.
- Locate the origin of a move, including a possible order block.
- Mark a fair value gap that may be revisited later.
- Separate directional movement from choppy price action.
- Define an invalidation point before considering an entry.
These are analytical uses, not guarantees. Price can retrace through an imbalance, reverse after a strong candle or produce a second displacement in the opposite direction.
How to identify displacement on a forex chart
When reviewing a displacement forex setup, use a repeatable process rather than deciding that a candle was displacement only after seeing the outcome.
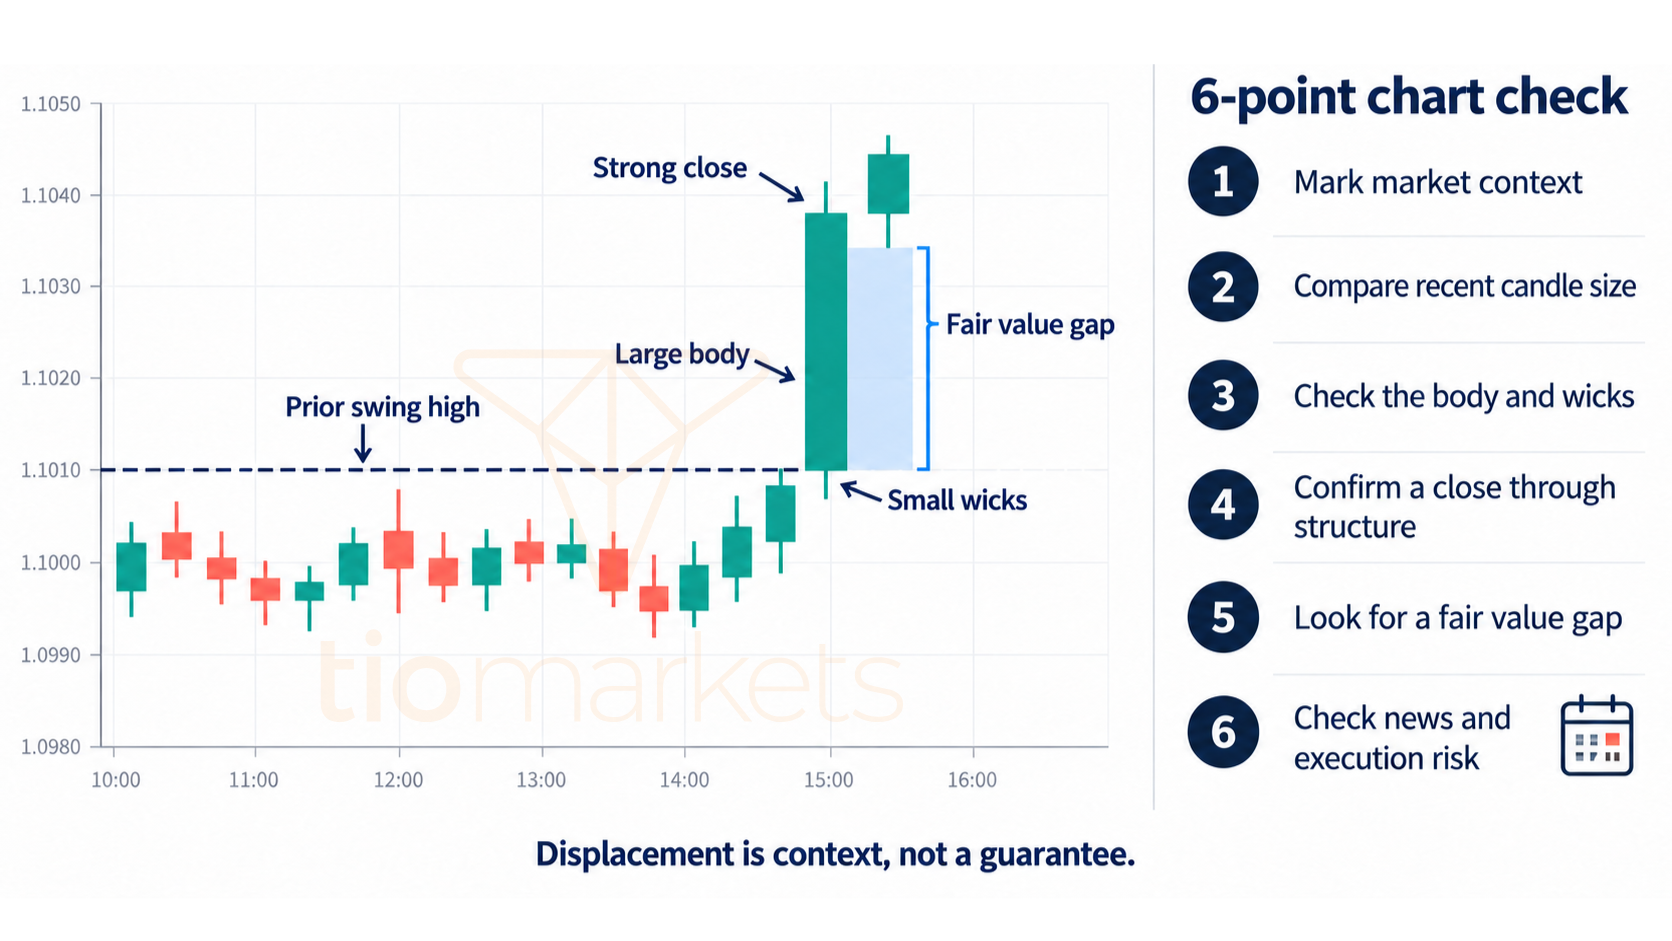
1. Start with market context
Mark the most relevant swing highs and lows, the current trading range and any clear support or resistance areas. Note whether the market is trending, ranging or reacting to scheduled economic news.
Context matters because a large candle in the middle of a range may carry less structural information than one that closes beyond a well-defined boundary.
2. Compare the candle with recent price action
The move should stand out from its surroundings. Compare its body and total range with the previous 10 to 20 candles on the same timeframe. A candle that looks large on a one-minute chart may be ordinary on a one-hour chart.
Avoid comparing unlike conditions. A London-session candle should not automatically be judged against a quiet period late in the trading day, and a news candle should not be treated as routine price action.
3. Check the body and wicks
A displacement candle usually has a dominant body and limited rejection. One optional measure is the body-to-range ratio:
Body-to-range ratio = absolute value of (close minus open), divided by (high minus low)
For example, a candle with a 24-pip body and a 30-pip high-to-low range has a ratio of 0.80, or 80%. That describes a directional close. It does not make 80% a universal rule.
Large wicks and a small body tell a different story. They show that price travelled but was rejected before the candle closed. That may be important, but it is closer to a volatility spike or rejection candle than clean displacement.
4. Look for a meaningful close through structure
Identify whether the candle closed beyond a relevant swing point. A wick through a level followed by a close back inside the prior range is usually a liquidity sweep or failed break, not confirmation that structure has changed.
The swing should be defined before the break. Choosing a convenient micro-swing after the move makes the test too easy and encourages hindsight bias.
5. Check for a fair value gap
A fair value gap is commonly described with a three-candle pattern. In a bullish gap, the low of the third candle remains above the high of the first candle. In a bearish gap, the high of the third candle remains below the low of the first candle. The space between those wicks shows limited overlap around the large middle candle.
A gap can support a displacement reading, but it does not have to be filled, hold as support or resistance, or lead to continuation. Treat it as a chart area to monitor rather than a promise.
6. Review the trigger for the move
Check the economic calendar. Interest-rate decisions, inflation data, employment reports and unexpected headlines can create oversized candles, wider spreads and slippage. A post-news displacement can be genuine price movement while still being difficult to trade at the displayed price.
TIOmarkets' guide to news trading in forex explains how volatility and reduced liquidity can affect execution around releases.
Bullish and bearish displacement forex moves
Bullish displacement occurs when price moves sharply higher and closes toward the top of the candle or candle sequence. Traders generally look for expanding bullish bodies, limited upper rejection and a close above a prior swing high or range boundary.
Bearish displacement is the opposite. Price moves sharply lower, closes toward the bottom of the range and may break a prior swing low or support area.
Direction alone is not enough. A bullish displacement candle that runs directly into higher-timeframe resistance may fail, while a bearish move during a broader uptrend may only be a temporary pullback. The higher-timeframe range and the location of the move remain important.
Displacement compared with similar chart concepts
| Concept | What it describes | Typical chart evidence |
| Displacement | The force and one-sided character of a move | Large body, strong close, limited wick and rapid travel |
| Momentum | The general rate or strength of price change | Consecutive directional candles or an indicator reading |
| Break of structure | Price crossing a defined swing point | Close beyond a prior high or low |
| Liquidity sweep | Price trading beyond a visible high or low before reacting | Wick or brief move through the level |
| Fair value gap | Limited overlap in a three-candle sequence | Wick-to-wick gap between candles one and three |
These ideas can occur together. For example, price may sweep a low, displace upward through a short-term swing high and leave a bullish fair value gap. Even then, the sequence is a framework for analysis rather than a standalone signal.
A practical way to measure displacement forex patterns
Displacement is often judged visually, which can lead to inconsistent decisions. A written rule makes analysis easier to test. You might record three variables:
1. Relative range: Compare the candle's total range with the average true range (ATR) or the median range of the previous 14 to 20 candles.
2. Body dominance: Calculate how much of the candle's range is occupied by its body.
3. Structural result: Record whether the candle closed beyond a swing that you marked in advance.
For research purposes, a trader could label a candle for review when its range is at least 1.5 times a recent ATR, its body occupies at least 60% of the range and it closes through a defined swing. These numbers are an example heuristic, not a market standard and not a recommendation. Different pairs, sessions and timeframes may require different definitions.
Test any rule on a meaningful sample and include spread, commission and slippage assumptions. Do not adjust the threshold for each chart simply to make past examples look successful.
Hypothetical EUR/USD displacement example
Assume EUR/USD has a short-term swing high at 1.0860. The first candle in a three-candle sequence has a high of 1.0840. The second candle opens at 1.0835, rises sharply and closes at 1.0870 with a large bullish body. It therefore closes above the previously marked swing high. The third candle pulls back only to 1.0855 before moving higher.
This hypothetical sequence contains three observations:
- The large middle candle shows bullish displacement relative to the surrounding candles.
- The close above 1.0860 breaks the defined short-term structure.
- The area from 1.0840 to 1.0855 is a bullish fair value gap because the first candle's high and third candle's low do not overlap.
A trader might mark that gap and wait to see how price behaves if it returns. A return is not guaranteed, and a touch of the gap is not automatically an entry. Before taking risk, the trader would still need a clear trigger, an invalidation level, a position size and an exit plan.
How traders incorporate displacement into a plan
There are several ways to use displacement forex observations without chasing the original candle.
Confirming a continuation break
In an established uptrend, bullish displacement through a prior high may support a continuation scenario. In a downtrend, bearish displacement through a prior low may serve the same purpose. Traders can then watch for an orderly pullback instead of entering after price has already expanded.
The breakout trading strategy guide covers the broader role of structure, support and resistance in breakout planning.
Assessing a reversal after a liquidity sweep
Some traders first look for price to run above a prior high or below a prior low and then displace in the opposite direction. In that model, the sweep identifies a possible failed move, while the opposing displacement supplies evidence that short-term behaviour has changed.
This sequence can still fail. A sweep may be followed by a temporary reaction before the original trend resumes.
Planning a retracement entry
Rather than buying the top of a bullish expansion or selling the bottom of a bearish one, a trader may wait for price to retrace toward the fair value gap, breakout level or origin of the move. Waiting can improve the entry price, but it also creates two other possibilities: price may never return, or it may retrace far enough to invalidate the setup.
Aligning multiple timeframes
Use a higher timeframe to define direction and key locations, then a lower timeframe to study the displacement. For example, a trader might mark a four-hour support area and observe a 15-minute bullish displacement from it.
Avoid adding timeframes until one supports the preferred answer. Decide in advance which timeframe sets context, which identifies the setup and which, if any, refines execution.
Risk management for displacement forex trading
A dramatic candle can create pressure to act quickly. That is precisely when a pre-written risk process matters.
- Define invalidation first. The stop location should represent the point at which the trade idea is no longer valid, not an arbitrary number of pips.
- Size the position from the stop. A wider technical stop requires a smaller position if the monetary risk is to remain fixed.
- Account for trading costs. Spread, commission and slippage affect the real result, especially on lower timeframes.
- Avoid chasing expansion. Entering after an extended candle can leave a poor distance between entry and invalidation.
- Know the news schedule. Fast markets may execute stop or market orders away from the requested level.
- Set an exit plan. Identify a logical target, management rule and maximum acceptable loss before placing the trade.
Read more about risk management in forex trading, including stop losses, position sizing and leverage. Risk controls can limit exposure, but they cannot remove trading risk or guarantee execution at a specified price.
Common displacement forex trading mistakes
Treating every large candle as displacement
Size alone is not enough. A large candle with long wicks, no structural break and no clear difference from current volatility may simply be noise.
Assuming a move reveals who traded
Candlestick data shows open, high, low and close prices. It does not identify the participants behind every transaction. Calling a move “institutional” may be part of a trading vocabulary, but the candle alone cannot prove that attribution.
Using thresholds as laws
Rules such as “1.5 times ATR” or “a 60% body” can make testing more consistent, but no single threshold defines all valid displacement. Document the rule and evaluate it rather than presenting it as universal.
Entering before the candle closes
A candle that looks powerful halfway through its period can develop a long wick before it closes. Waiting for the selected timeframe to complete gives a more stable reading, although it can also mean a later entry.
Ignoring the higher timeframe
Lower-timeframe displacement may occur inside an unimportant part of a larger range. Check whether the move is approaching a significant higher-timeframe level.
Believing every fair value gap must fill
Price can revisit an imbalance immediately, much later or not at all. Even when it returns, it can pass straight through. A gap is an observation, not an obligation imposed on the market.
Displacement forex checklist
Before treating a move as useful displacement, ask:
- Did I mark the relevant swing or range boundary before the move?
- Is the candle or sequence unusually large for this pair, session and timeframe?
- Does the body dominate the range, with limited opposing wick?
- Did price close through structure rather than only wick beyond it?
- Is there a fair value gap or clean separation from the prior range?
- Did scheduled news create unusual volatility, spreads or slippage risk?
- Does the higher timeframe support, oppose or add no useful context?
- Where is the setup invalidated?
- Is the planned position size consistent with my maximum risk?
- Have I tested the same definitions on historical and demo data?
For more help reading unfiltered charts, see TIOmarkets' introduction to a price action trading strategy.
Practise displacement analysis on a chart
The clearest way to learn displacement forex analysis is to mark examples in real time and record what happened next without changing the definition afterward. TIOmarkets' trading platforms provide charting tools for studying market structure across multiple timeframes.
You can also open a demo trading account to practise with virtual funds before considering live trading. Demo conditions may not fully reproduce the slippage, liquidity, costs or emotional pressure of a live account.
Trading leveraged products is risky. Losses can occur quickly, and past performance is not a reliable indicator of future results. This material is for educational purposes only and does not constitute investment advice.

FAQ
Risk disclaimer: CFDs are complex instruments and come with a high risk of losing money rapidly due to leverage. You should consider whether you understand how CFDs work and whether you can afford to take the high risk of losing your money. Never deposit more than you are prepared to lose. Professional client’s losses can exceed their deposit. Please see our risk warning policy and seek independent professional advice if you do not fully understand. This information is not directed or intended for distribution to or use by residents of certain countries/jurisdictions including, but not limited to, USA & Countries included in the OFAC sanction list. The Company holds the right to alter the aforementioned list of countries at its own discretion.
TIOmarkets offers an exclusively execution-only service. The views expressed are for information purposes only. None of the content provided constitutes any form of investment advice. The comments are made available purely for educational and marketing purposes and do NOT constitute advice or investment recommendation (and should not be considered as such) and do not in any way constitute an invitation to acquire any financial instrument or product. TIOmarkets and its affiliates and consultants are not liable for any damages that may be caused by individual comments or statements by TIOmarkets analysis and assumes no liability with respect to the completeness and correctness of the content presented. The investor is solely responsible for the risk of his/her investment decisions. The analyses and comments presented do not include any consideration of your personal investment objectives, financial circumstances, or needs. The content has not been prepared in accordance with any legal requirements for financial analysis and must, therefore, be viewed by the reader as marketing information. TIOmarkets prohibits duplication or publication without explicit approval.
Join us on social media



Authors BIO

Eleni is a financial markets enthusiast contributing to content covering forex, indices, commodities, and global market developments. She is passionate about researching market-related topics and helping make financial information more accessible to traders.





