


Commodity Currencies Explained: Why AUD and CAD Diverged
BY TIOmarkets
|November 19, 2026Commodity currencies are the currencies of economies in which raw materials such as metals, energy and farm goods account for a large share of exports, so that commodity prices reach the exchange rate through national income. The Australian dollar (AUD), Canadian dollar (CAD), New Zealand dollar (NZD) and Norwegian krone (NOK) are the standard examples. Were commodity currencies explained by one shared commodity price, they would move together; in practice the label describes an export profile rather than a shared driver, and two such currencies can respond differently to the same market event.
The US dollar rally of mid-November 2026 illustrates the point: AUD and CAD both weakened, but on different news. The article sets out each country's export basket, the oil and metals channels, the domestic jobs data and central bank expectations behind each currency, and what the AUD/CAD cross records when the two move apart. It is written for retail traders who treat AUD and CAD as interchangeable commodity dollars. Prices and data are as of 19 November 2026.
Why Is AUD/USD Falling in November 2026?
The US dollar strengthened broadly in the first half of November 2026. On Friday 13 November, the US Dollar Index (DXY), which measures the dollar against a basket of major currencies, traded near 103.33, its highest level in 19 months. On 18 November the dollar remained near that 19-month high, supported by hawkish signals from the Federal Reserve, that is, signals favouring tighter US monetary policy.
Both commodity currencies weakened against the dollar, but on different news and on different days. The Australian dollar fell to a ten-month low after weaker-than-expected employment data, and AUD/USD declined 0.4% to $0.6691 following the release. USD/CAD, which rises when the Canadian dollar weakens, fell back on 19 November from a fresh 19-month high of 1.4357. It then traded flat around 1.4330 in European hours, while WTI crude held above $82.00 per barrel.
The Canadian dollar tracked oil. On 13 November an oil rebound helped CAD outperform its major peers, and USD/CAD paused a three-day winning streak around 1.4248. On 18 November falling oil prices and a firmer US dollar weighed on CAD at the same time. The Australian dollar responded to its own labour market instead, so the explanation of why the Australian dollar fell in November begins with Australian data rather than with commodity prices. These moves are a historical record, and past performance is not a reliable indicator of future results.
Commodity Currencies Explained: What the Label Means
The mechanism behind the label is the terms of trade, the ratio of a country's export prices to its import prices. When export prices rise relative to import prices, a given volume of exports pays for more imports and national income increases. Exporters convert larger foreign earnings into the domestic currency, investment is drawn towards the commodity sector, and the central bank faces a firmer economy. This link between terms of trade and currency value is the route by which a commodity price move can appear in an exchange rate.
Canada shows the channel directly. Lower oil prices weigh on CAD because energy exports are an important source of the country's foreign income, which is why the Canadian dollar is classed as a commodity currency. Australia works through the same channel with a different basket, led by iron ore, liquefied natural gas (LNG), coal and gold.
The classification is informative because it identifies which external prices can feed into a currency. It becomes misleading when it is read as a single trade. Commodities do not share one price: iron ore, crude oil, wheat and natural gas respond to different buyers and different cycles. Grouping AUD, CAD and NZD together also obscures the domestic side, since each currency carries its own interest rate and its own data calendar.
Difference Between AUD and CAD: Two Export Baskets
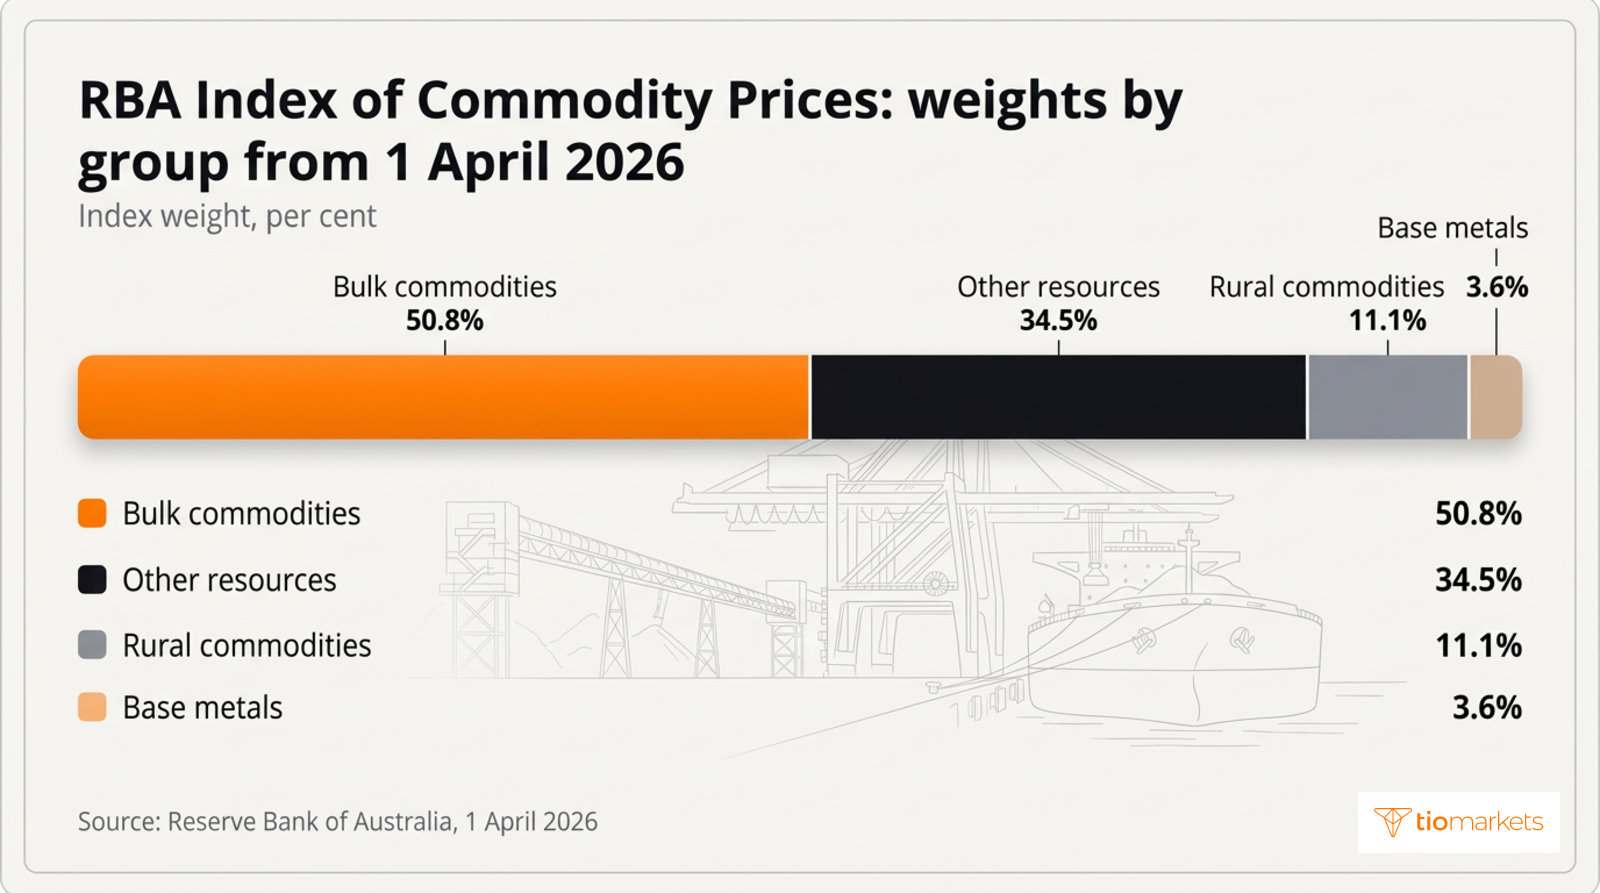
Each central bank's commodity price index records the exposure of its currency. The RBA Index of Commodity Prices is weighted by export values: from 1 April 2026 it uses an average of export values in 2023/24 and 2024/25, rebased so that the 2024/25 average equals 100. Bulk commodities carry 50.8% of the weight, other resources 34.5%, rural commodities 11.1% and base metals 3.6%.
The Bank of Canada Commodity Price Index (BCPI) is built on a different principle. It is a chain Fisher price index, which compares prices using weights from both the earlier and the later period and links those comparisons in a chain. It covers the spot or transaction prices, in US dollars, of 26 commodities produced in Canada and sold in world markets. The Bank of Canada adopted this design in 2010 in place of a fixed-weight index. Its weights are updated every year from annual production values, drawn mainly from Statistics Canada input-output tables that are only available with a lag. Its oil component uses WTI and Brent front-month futures and the Western Canadian Select spot price index.
The two designs measure different things. An export-weighted index tracks the income Australia earns from foreign sales, so it leans towards the bulk materials shipped abroad. A production-weighted index tracks the value of what Canada produces, and prices its oil from North American and international crude benchmarks. The two currencies therefore differ on most of the inputs that drive them:
| Point of comparison | Australian dollar (AUD) | Canadian dollar (CAD) |
| Central bank | Reserve Bank of Australia (RBA) | Bank of Canada (BoC) |
| Commodity price index | RBA Index of Commodity Prices | Bank of Canada Commodity Price Index (BCPI) |
| How the index is weighted | Export values, average of 2023/24 and 2024/25 | Annual production values, updated every year |
| Main commodity inputs | Iron ore 30.9%, LNG 16.3%, metallurgical coal 11.4%, gold 9.8% | 26 commodities; oil priced from WTI, Brent and Western Canadian Select |
| Crude oil in the index | 2.6% weight | Three oil price series in the oil component |
| Main driver reported in November 2026 | October labour data: unemployment rate up to 4.9% | Daily swings in oil prices against a stronger US dollar |
Canada's trade figures show how the energy line moves within a larger total. Statistics Canada reported that the merchandise trade surplus rose to $3.9 billion in June 2026, from a revised $3.7 billion in May. Total exports rose 0.4% to a record $77.5 billion, while energy product exports fell 10% as oil prices dropped. Energy can swing sharply without determining the export total, which is one reason the oil link to CAD is real but uneven.
How Oil Prices Affect the Canadian Dollar
Oil reaches the Canadian dollar through three routes. The first is export revenue: higher crude prices raise the US dollar value of energy sales, and those receipts are converted into Canadian dollars. The second is the price Canadian producers actually receive. WTI (West Texas Intermediate) is the US benchmark, while Western Canadian Select is a heavier Canadian crude that trades at a discount to it, so a WTI rally benefits producers only to the extent that the discount does not widen. The third is capital: higher prices can draw investment into the energy sector, which also requires Canadian dollars.
Mid-November 2026 showed the channel operating against a strong US dollar. On 18 November, falling oil prices and a firmer dollar weakened CAD together. On 19 November the balance shifted. Hawkish minutes from the Federal Reserve lifted the US dollar, but WTI holding above $82.00 per barrel supported the Canadian dollar, and USD/CAD eased from its 1.4357 high to trade flat around 1.4330. Oil offset the dollar's strength without reversing it. Both sessions describe past market behaviour, and as with any past performance, they are not a reliable indicator of future results.
The strength of the link varies even within a single week. US crude stockpiles rose by 3.4 million barrels to 417.8 million barrels in the week ending 13 November 2026, which tempered the rise in oil prices. An inventory build, a move in the US dollar or a change in rate expectations can each outweigh the oil effect on a given day. The relationship between oil and CAD is therefore a channel of varying strength rather than a fixed ratio.
Iron Ore and the Australian Dollar
Australia's commodity exposure is concentrated in bulk materials. In the RBA Index of Commodity Prices weights in force from 1 April 2026, iron ore carries 30.9%, the largest single weight, followed by LNG at 16.3%, metallurgical coal at 11.4%, gold at 9.8% and thermal coal at 8.5%. Crude oil carries 2.6%, less than beef and veal at 3.5%.
These weights explain why an oil rally gives AUD little of the support it gives CAD. Iron ore and metallurgical coal are steel-making inputs, so their prices follow steel output and construction activity, in which demand from China is a central element. A basket built on steel inputs also leaves AUD sensitive to risk sentiment, the market's appetite for assets linked to global growth. The connection between iron ore and the Australian dollar therefore runs through industrial demand in Asia rather than through North American energy markets.
The basket also changes over time. The April 2026 reweighting raised iron ore from 28.8% to 30.9% and gold from 6.3% to 9.8%, while thermal coal fell from 11.4% to 8.5%. Nickel returned to the index after its share of commodity export value rose to around 0.1%. Because the weights follow export values, the index records how Australia's exposure shifts between bulk materials, energy and precious metals.
Domestic Data and Central Banks: RBA vs Bank of Canada
Commodity prices are only part of what moves either currency. Each pair also carries an interest rate differential, the gap between the policy rates expected in the two economies. Domestic data shifts that gap by changing what markets expect from the Reserve Bank of Australia (RBA) or the Bank of Canada. The Federal Reserve sets the US side of both AUD/USD and USD/CAD, which is why hawkish Fed signals in November lifted the dollar against both.
For AUD, the release that moved the currency in November was the Labour Force Survey for October 2026, reported on 18 November in North American time. The October figures were weak across the main measures:
- Unemployment rate, the seasonally adjusted share of the labour force without work and looking for it: 4.9%, up from 4.7% in September and above expectations of 4.7%, the highest since October 2021.
- Employment change, the monthly change in the number of people in work: a fall of 43,500 against forecasts of a 25,500 increase, the third decline in four months, with September revised to a fall of 36,400.
- Number unemployed: up 17,800 to 753,700.
- Employment-to-population ratio, the share of the working-age population in a job: down from 63.6% to 63.3%.
- Hours worked, a measure of how much labour the economy uses rather than how many people hold jobs: down 0.2%.
AUD/USD fell 0.4% to $0.6691 after the release as rate expectations shifted. Pricing in overnight indexed swaps (OIS), contracts that track the average policy rate over a set period, moved to imply about 31.3 basis points of RBA rate cuts by November 2027, up from 6.2 basis points earlier that week. The repricing moved the expected interest rate differential against the Australian dollar, and that is the route by which a jobs report reaches a currency. A single release-day reaction is a historical observation, and past performance is not a reliable indicator of future results.
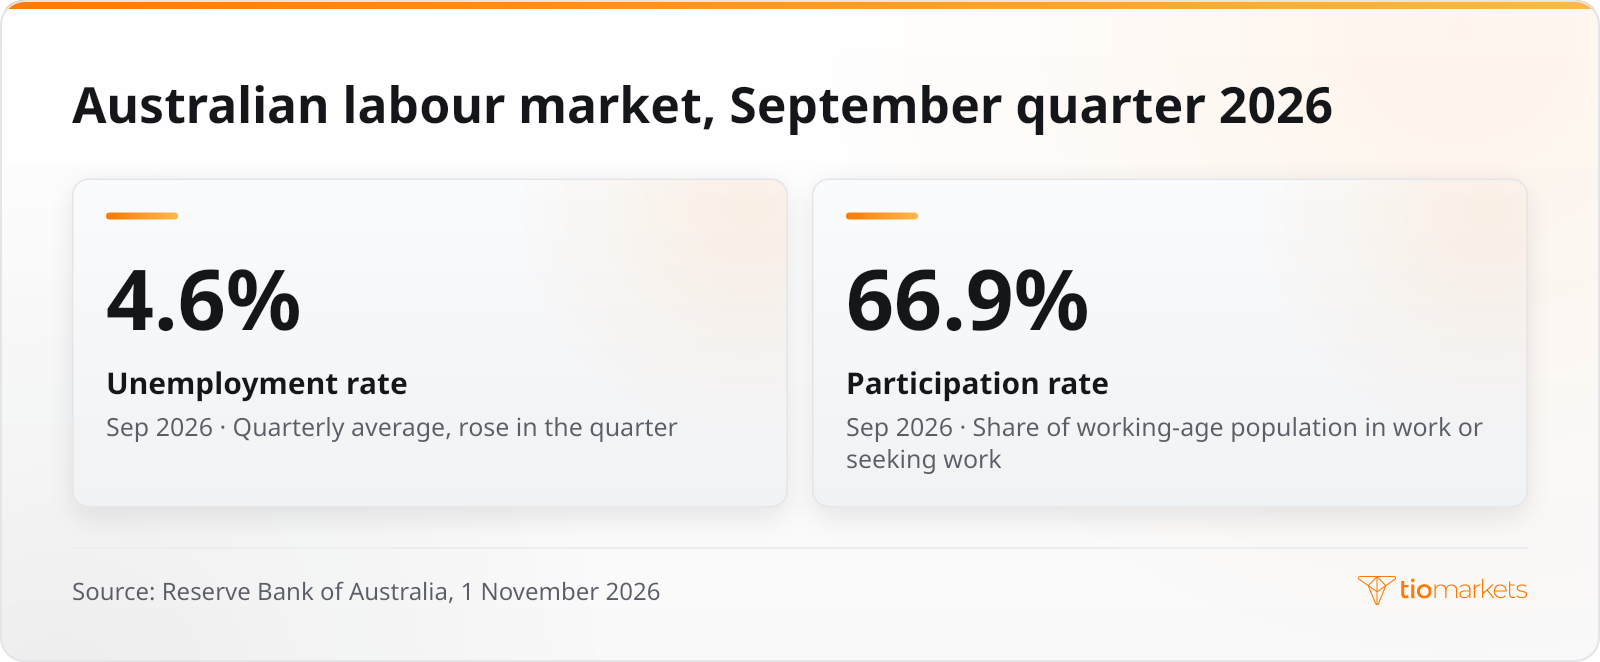
The October figures extended a softening already visible in the September quarter. In that quarter the unemployment rate rose more than expected to average 4.6%, and the participation rate, the share of the working-age population in work or looking for work, rose to 66.9%.
The same mechanism applies to CAD through Canada's own Labour Force Survey and the Bank of Canada's expected rate path. In mid-November 2026, however, the Canadian dollar's daily moves followed oil and the US dollar. AUD absorbed a domestic shock that CAD did not, and that difference, more than any commodity price, separated the two currencies during the same dollar rally.
What Moves AUD/CAD
AUD/CAD quotes the price of one Australian dollar in Canadian dollars. Because the US dollar sits on the other side of both AUD/USD and USD/CAD, a broad dollar move largely cancels out in the cross. What remains is the gap between the two economies: metals against energy, Australian data against Canadian data, the RBA against the Bank of Canada. The AUD/CAD chart records that gap directly. A weak Australian jobs report weakens the base currency and firmer oil supports the quote currency, and both push the quoted rate lower.
Treating AUD and CAD as interchangeable can alter exposure without a trader recognising it. A long AUD/USD position and a short USD/CAD position resemble two separate commodity views, yet both are short the US dollar, so the dollar exposure is doubled. A long AUD/USD position combined with a long USD/CAD position cancels the dollar instead and leaves, in effect, a long AUD/CAD position: a position on Australia's economy against Canada's.
Where such positions are held through leveraged products, the overlap carries greater consequences. Leverage magnifies losses as well as gains, so a doubled dollar exposure turns one adverse US dollar move into losses on both positions at once. Those losses can build quickly in a session such as 18 November, when oil and the dollar moved against CAD together, and a trader can lose all the money deposited.
The New Zealand dollar provides a third comparison. Setting NZD/USD beside AUD/USD and USD/CAD helps separate a move that belongs to the US dollar, which affects all three, from one that belongs to a single economy. How the New Zealand dollar trades against the US dollar rests on the same three elements: export profile, domestic data and central bank.
What Is Scheduled Next for AUD and CAD
The next confirmed event for AUD is the RBA's policy meeting on 8 December 2026, the first decision since the October labour data shifted rate pricing. The RBA sets the cash rate target, the interest rate on overnight loans between banks, and its accompanying statement sets out how the central bank weighs the labour market against inflation. Other recurring releases feed the same channels, each measuring something different:
- Australian monthly CPI: the change in consumer prices, which the RBA weighs alongside the labour data.
- Australian Labour Force Survey: the next monthly reading of employment, unemployment and hours worked.
- Canadian GDP: the value of output in the Canadian economy, including the contribution of the energy sector.
- Canadian Labour Force Survey: Canada's monthly employment and unemployment figures, which feed Bank of Canada expectations.
- Bank of Canada rate decisions: any change to the policy rate and the Bank's assessment of the economy.
- Weekly US crude inventories: changes in US stockpiles, which affect WTI and, through it, the oil channel to CAD.
Inflation data reaches a currency through the same rate-expectation route as jobs data, a process set out in how CPI affects currency markets. Each statistics agency and central bank publishes its own release calendar with confirmed dates and times. The readings, set against expectations, are what the two currencies respond to.
Conclusion
A commodity currency is a description of an export profile, not a single trade. AUD and CAD both earn foreign income from raw materials, but Australia's basket is led by iron ore, LNG and coal, while Canada's is priced off WTI, Brent and Western Canadian Select. Each currency also answers to its own labour data and central bank. In November 2026 the US dollar rally weighed on both, yet the Australian dollar absorbed a domestic jobs shock while the Canadian dollar moved with oil. Reading the export basket, the release calendar and the AUD/CAD cross together explains such a divergence once it has occurred.
These drivers explain moves after the event; they do not determine what a currency does next, because the weight of each channel shifts from week to week and a single release or inventory report can override it. Trading AUD/USD, USD/CAD or AUD/CAD on margin adds a further layer of risk. Leverage enlarges losses in the same proportion as gains, losses on currency positions can accumulate within hours of a data release, and traders can lose all of the money they deposit.
Symbols in this article
- Crude Oil (WTI)USOIL
- AUD/USD
- USD/CAD
- AUD/CAD
- Brent Crude OilUKOIL
- US Dollar IndexDXY
- Natural GasXNGUSD
- NZD/USD





Trade US Oil and USD/CAD with TIOmarkets
Take your position on global markets via CFDs. Enjoy tight spreads, fast execution, and fast, flexible funding options.
Trading is risky
FAQ
Risk disclaimer: CFDs are complex instruments and come with a high risk of losing money rapidly due to leverage. You should consider whether you understand how CFDs work and whether you can afford to take the high risk of losing your money. Never deposit more than you are prepared to lose. Professional client’s losses can exceed their deposit. Please see our risk warning policy and seek independent professional advice if you do not fully understand. This information is not directed or intended for distribution to or use by residents of certain countries/jurisdictions including, but not limited to, USA & Countries included in the OFAC sanction list. The Company holds the right to alter the aforementioned list of countries at its own discretion.
TIOmarkets offers an exclusively execution-only service. The views expressed are for information purposes only. None of the content provided constitutes any form of investment advice. The comments are made available purely for educational and marketing purposes and do NOT constitute advice or investment recommendation (and should not be considered as such) and do not in any way constitute an invitation to acquire any financial instrument or product. TIOmarkets and its affiliates and consultants are not liable for any damages that may be caused by individual comments or statements by TIOmarkets analysis and assumes no liability with respect to the completeness and correctness of the content presented. The investor is solely responsible for the risk of his/her investment decisions. The analyses and comments presented do not include any consideration of your personal investment objectives, financial circumstances, or needs. The content has not been prepared in accordance with any legal requirements for financial analysis and must, therefore, be viewed by the reader as marketing information. TIOmarkets prohibits duplication or publication without explicit approval.
Join us on social media


Authors BIO

Behind every blog post lies the combined experience of the people working at TIOmarkets. We are a team of dedicated industry professionals and financial markets enthusiasts committed to providing you with trading education and financial markets commentary. Our goal is to help empower you with the knowledge you need to trade in the markets effectively.