


Nvidia Earnings Explained: What the Q3 Report Showed
BY TIOmarkets
|November 20, 2026Nvidia earnings are the quarterly results Nvidia publishes for each fiscal quarter, covering revenue by market platform, gross margin, GAAP and non-GAAP earnings per share, cash returned to shareholders and guidance for the following quarter. On 17 November 2026, Nvidia reported third-quarter fiscal 2027 revenue of $115.8 billion, 20% higher than in the previous quarter and 103% higher than a year earlier. Non-GAAP diluted EPS was $2.68, against a consensus of $2.48.
This explainer works through the release line by line for professional retail traders: what each figure measures, how the non-GAAP adjustments work, how the surprise against consensus is calculated, and how the share and the Nasdaq 100 reacted, as reported up to 18 November 2026. Its point is that a headline beat says little on its own. The reaction depends more on guidance against consensus and on Nvidia's index weight than on the quarter itself.
Nvidia Earnings: The Q3 Fiscal 2027 Headline Figures
Nvidia published its results after the US close on Tuesday, 17 November 2026, in a press release filed with the Securities and Exchange Commission on Form 8-K, and set out its outlook in a separate CFO commentary. The conference call followed at 2 p.m. Pacific time (5 p.m. Eastern time). It was webcast on the company's investor relations website, where a replay remains available until the call on fourth-quarter and full fiscal 2027 results.
The practical question for a trader is whether a reported beat reaches the share price and the index, and when. With the figures published after the regular session, the first reaction came in after-hours trading, the electronic session that follows regular hours. The Nasdaq 100 is calculated from regular-session prices, so the cash index reflects that move only at the next open, although instruments quoted outside those hours can move first.
The release sets each line against both the previous quarter and the same quarter a year earlier, and the two comparisons rarely tell the same story. Its layout is standard for US quarterly results, as a general explanation of earnings reports and where to find them sets out: a summary of the income statement comes first, and the reconciliation of adjusted measures appears further down.
| Line | Q3 FY27 | Compared with | Change |
| Revenue | $115.8bn | Q2 FY27; Q3 FY26 | +20% q/q; +103% y/y |
| Data Center revenue | $107.6bn | Q2 FY27; Q3 FY26 | +21% q/q; +110% y/y |
| GAAP gross margin | 74.8% | 75.0% in Q2 FY27; 73.4% in Q3 FY26 | -0.2 pts q/q; +1.4 pts y/y |
| Non-GAAP gross margin | 74.9% | 75.0% in Q1 FY27 | – |
| GAAP diluted EPS | $2.70 | $1.30 in Q3 FY26 | +108% y/y |
| Non-GAAP diluted EPS | $2.68 | $1.27 in Q3 FY26 | +111% y/y |
| GAAP net income | $65.3bn | $59.7bn in Q2 FY27; $31.9bn in Q3 FY26 | +9% q/q; +105% y/y |
| Non-GAAP net income | $64.9bn | $54.0bn in Q2 FY27; $31.0bn in Q3 FY26 | +20% q/q; +109% y/y |
| Free cash flow | $43,777m | $22,089m in Q3 FY26 | – |
Four figures carry most of the quarter's information: revenue of $115.8 billion, Data Center revenue of $107.6 billion, GAAP net income of $65.3 billion, and $28.1 billion returned to shareholders through share repurchases and cash dividends. Each answers a separate question, from the scale of demand to the share of the resulting cash that left the company.
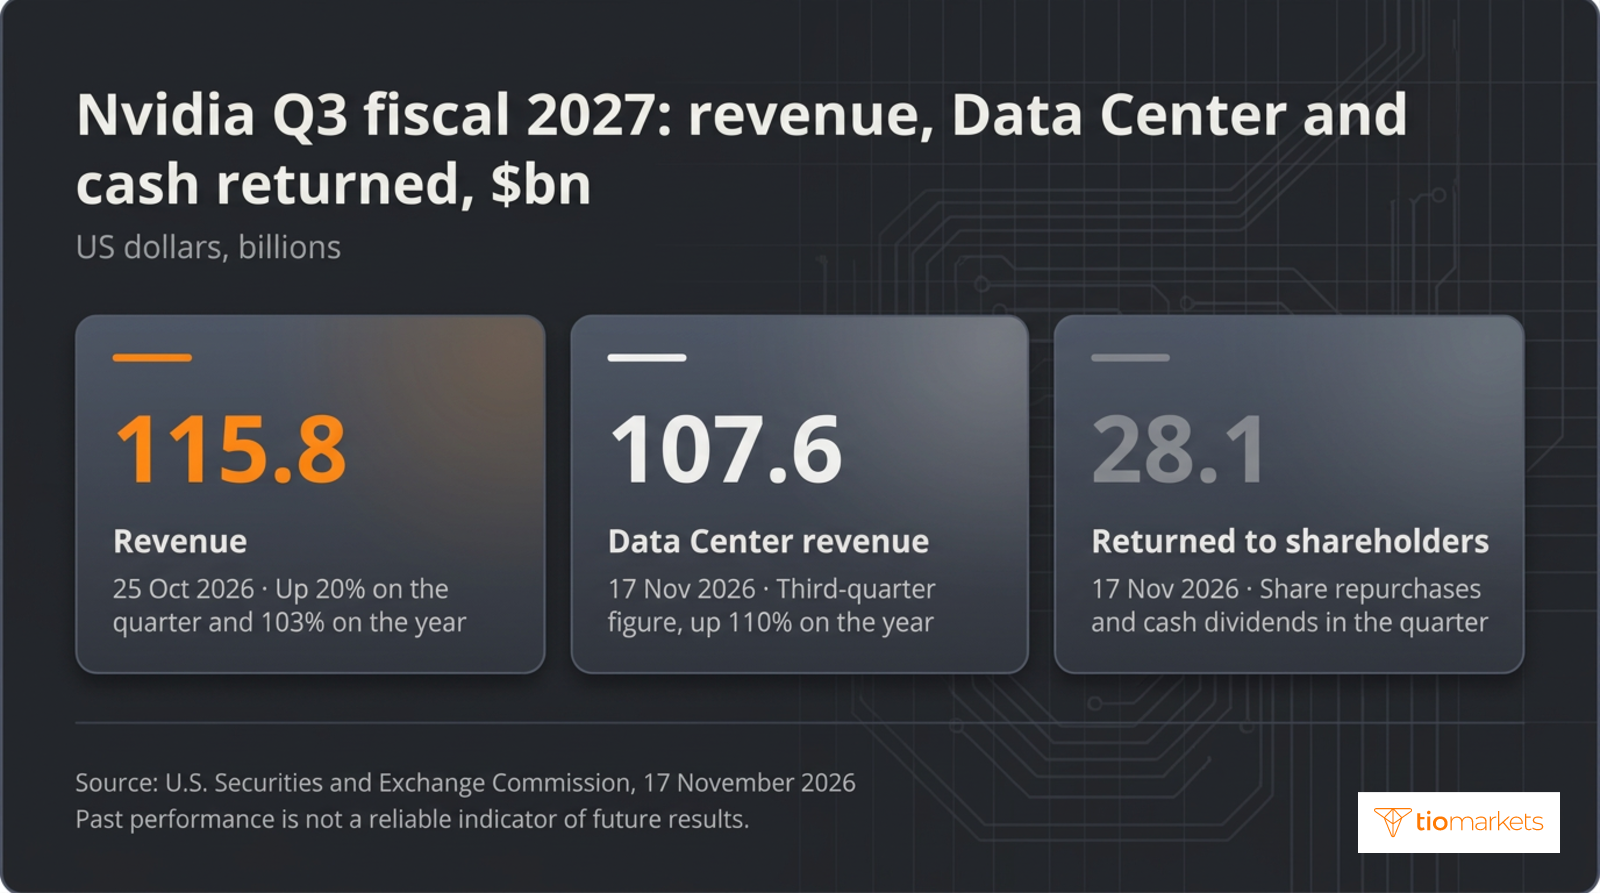
Nvidia's fiscal year does not follow the calendar year. The third quarter of fiscal 2027, reported in November, ended on 25 October 2026, so the fiscal label runs one year ahead of the calendar. Year-on-year comparisons set the quarter against the third quarter of fiscal 2026, and the fiscal 2028 growth figure given on the call refers to the following fiscal year.
How Much of Nvidia Revenue Is Data Center?
Data Center accounted for 92.9% of Nvidia's revenue in the third quarter: $107.6 billion of $115.8 billion. Edge Computing, the second market platform, contributed the remaining $8.2 billion, or 7.1%, up 14% on the quarter and 42% on the year. In the first quarter of fiscal 2027, Data Center revenue was $75.2 billion, or 92% of total sales. Over two quarters the platform added $32.4 billion, a rise of 43.1%, while its share of the total barely moved.
Nvidia introduced its two-platform framework, Data Center and Edge Computing, in the first quarter of fiscal 2027, and divided Data Center into two sub-markets: Hyperscale, and AI clouds, industrial and enterprise (ACIE). In the third quarter, Nvidia Data Center revenue explained almost all of the company's sequential growth. The sub-market figures, given year on year, showed where the annual growth came from: Hyperscale revenue was $60.1 billion, up 71%, and ACIE revenue $47.5 billion, up 195%. Hyperscale made up 55.9% of the platform and ACIE 44.1%, yet the smaller sub-market grew at well over twice the rate of the larger one.
Quarter-on-quarter and year-on-year growth measure different things. The 103% annual rise means revenue roughly doubled from about $57.0 billion in the third quarter of fiscal 2026. The 20% sequential rise implies a second quarter of about $96.5 billion, an increase of about $19.3 billion in three months. The annual rate shows how far the business has grown; the sequential rate, read beside Data Center's 21%, shows the latest pace and is the base against which next-quarter guidance is read.
That concentration governs how the report is read. With more than nine-tenths of revenue in one platform, the company total is in effect a reading of data centre demand, much of it hyperscaler capital expenditure: the largest cloud providers' spending on servers, networking and buildings. The fourth-quarter outlook assumes no Data Center compute revenue from China, which shows how one assumption about one platform can alter company-wide guidance.
Nvidia GAAP vs Non-GAAP EPS and Gross Margin
Gross margin is revenue less the cost of revenue, expressed as a share of revenue. The third-quarter GAAP figure of 74.8% means that 74.8 cents of each dollar of sales remained after the cost of what was sold, before operating expenses. That was 0.2 percentage points below the second quarter's 75.0% and 1.4 points above the 73.4% of a year earlier. The non-GAAP figure was 74.9%.
The ratio responds to forces in both directions. A richer mix of higher-priced products and firmer pricing raise it, while the cost of ramping new products and inventory-related charges lower it. Fourth-quarter guidance of between 71.0% and 72.0% sits 2.8 to 3.8 points below the third-quarter GAAP level.
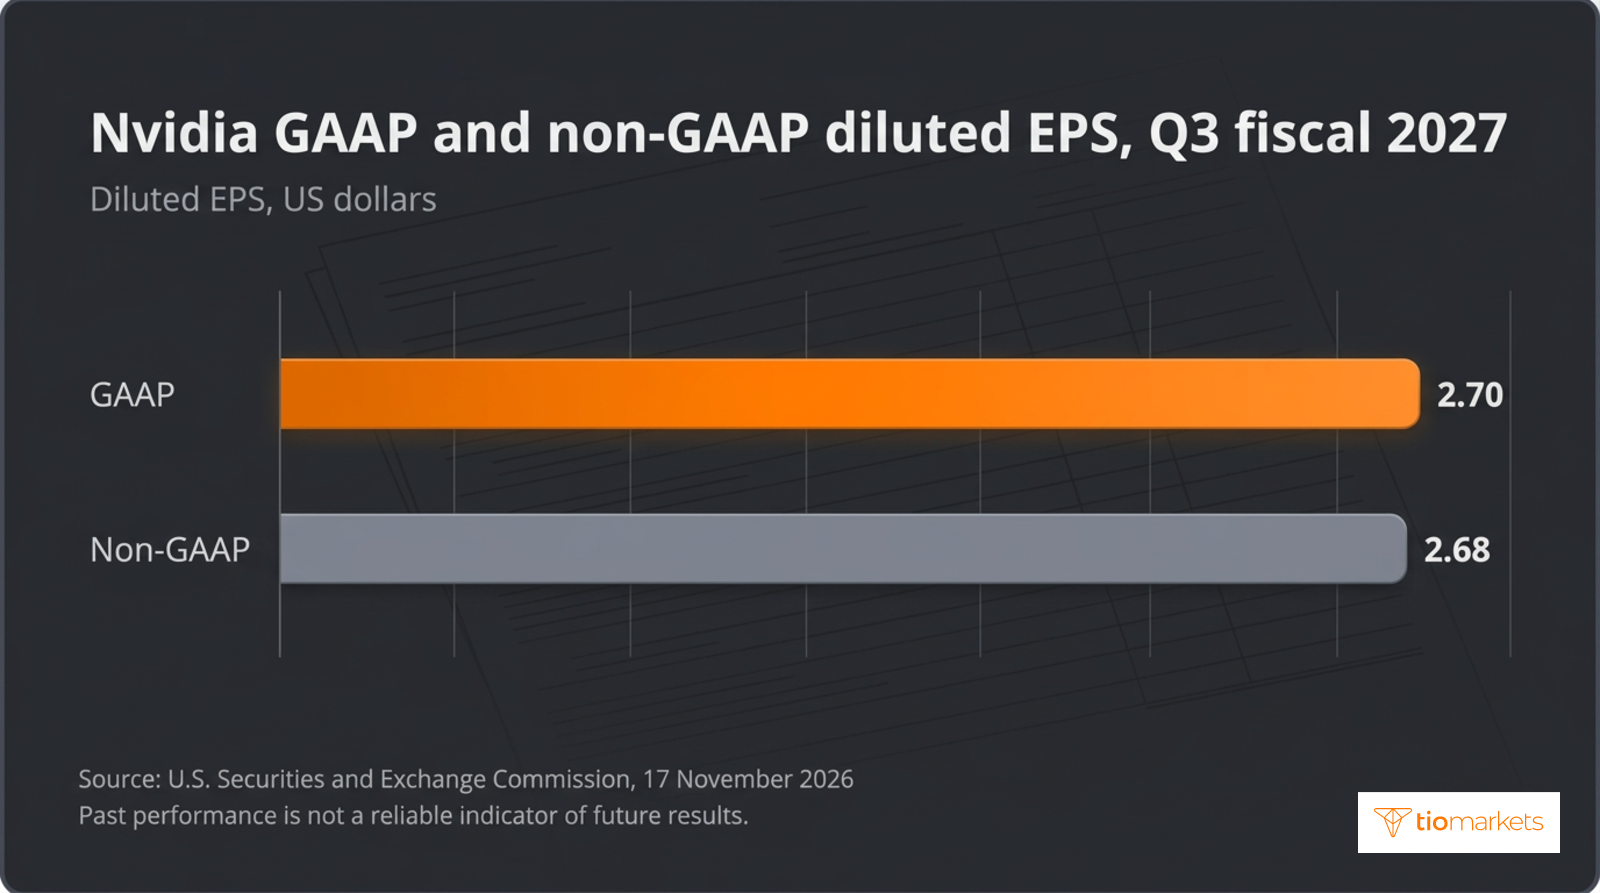
GAAP diluted EPS, $2.70 in the quarter, divides net income under US generally accepted accounting principles by the diluted share count, which includes shares that options and awards could add. Non-GAAP diluted EPS, $2.68, removes items the company treats as outside its operating performance. Nvidia publishes a reconciliation of the two with its results, but the choice of adjustments rests with management, so the definition matters as much as the number.
That definition changed this fiscal year. From the first quarter of fiscal 2027, the non-GAAP measures no longer exclude stock-based compensation, the cost of paying employees in shares, and historical figures were restated to include it. In fiscal 2025 and 2026 they had excluded stock-based compensation, acquisition-related and other costs, other items, gains and losses on non-marketable and publicly held equity securities, interest expense from the amortisation of debt discount, and the associated tax impact. A figure quoted under the old definition is not comparable like for like.
The third-quarter reconciliation runs from GAAP to non-GAAP in four steps:
- It starts from GAAP operating income of $77.5 billion, up 22% on the quarter and 115% on the year.
- Adjustments at the operating level add a total of $363 million, raising non-GAAP operating income to $77,883 million.
- The remaining adjustments, below operating income, lower the figure by a net $780 million, taking net income from $65,287 million under GAAP to $64,870 million on the non-GAAP basis.
- Divided by the diluted share count, that net $417 million reduction becomes the two-cent gap between GAAP EPS of $2.70 and non-GAAP EPS of $2.68.
The reconciliation shows totals by category, not the judgement behind each one. Non-GAAP net income sat below GAAP net income in all three periods shown, but by very different amounts: $417 million in the third quarter, $5,734 million in the second ($53,954 million against $59,688 million) and $931 million a year earlier. That wider second-quarter gap is why GAAP net income grew 9% on the quarter while non-GAAP net income grew 20%, so the headline growth rate depends on which measure is quoted.
Did Nvidia Beat Earnings?
Nvidia beat consensus for both revenue and EPS in the third quarter, whichever consensus series is used, and exceeded its own guidance. A consensus estimate is the average of the forecasts analysts submit to a data provider for a given line. Providers differ in their analyst panels, their cut-off times and whether a line is compiled on an adjusted or a GAAP basis. One series put EPS at $2.48 and revenue at $109.11 billion; another put them at $2.47 and $109.5 billion.
An earnings surprise is the reported figure minus the consensus, divided by the consensus and expressed as a percentage. The comparison uses non-GAAP EPS of $2.68, the adjusted measure analysts forecast, rather than the GAAP $2.70. Against the first series, $2.68 minus $2.48 is $0.20, and $0.20 divided by $2.48 gives a surprise of 8.1%. Against the second, the reported beats were 5.8% on revenue and 8.4% on EPS. The difference arises entirely from the choice of consensus.
| Line | Reported | Consensus or guidance | Surprise |
| Non-GAAP diluted EPS | $2.68 | $2.48 consensus | +8.1% |
| Revenue | $115.84bn | Consensus estimate $109.11bn | +6.2% |
| Data Center revenue | $107.61bn | $101.87bn estimate | +5.6% |
| Revenue against company guidance | $115.8bn | $108bn guided | +7.2% |
A beat of this size does not by itself set the size of the share move. A share price already reflects what market participants expected, and that expectation can sit above the published consensus for a company that has exceeded estimates before. Guidance therefore weighs as much as the reported quarter: on the second series, the $130 billion midpoint of fourth-quarter revenue guidance was 4.2% above consensus, a narrower margin than the 5.8% revenue beat.
Nvidia Revenue Guidance Next Quarter and Cash Returned
Nvidia's outlook for the fourth quarter of fiscal 2027 is revenue of $130.0 billion, plus or minus 3%, a range of $126.1 billion to $133.9 billion, for a quarter that includes an additional week and assuming no Data Center compute revenue from China. GAAP and non-GAAP gross margins are guided between 71.0% and 72.0%, and operating expenses at about $11.0 billion GAAP and $10.7 billion non-GAAP, against GAAP operating expenses of $9.2 billion in the third quarter.
All of these figures are the company's own. The revenue midpoint is 12.3% above third-quarter revenue, a comparison that includes the extra week. On the call, outside the 8-K outlook, Colette Kress raised the fiscal 2028 growth figure: "We expect revenue to grow approximately 75% year over year, up from 70%", a rate that now applies to a higher fiscal 2027 base.
The Nvidia share buyback and dividend figures show how much of the quarter's cash left the company. Nvidia returned $28.1 billion in the third quarter; on the call it put the total at $28 billion, made up of $22 billion of share repurchases and $6 billion of cash dividends. Free cash flow, operating cash flow less purchases of and principal payments on property, equipment and intangible assets, was $43,777 million, against $22,089 million a year earlier. The quarter's returns equalled about 64.2% of free cash flow, close to the 65% the company said it had returned year to date.
In September 2026 the Board approved a $150 billion increase to the share repurchase authorisation, without expiration, and about $227.3 billion remained at quarter end. Shares issued through employee equity awards work in the opposite direction to repurchases and add to the count. Weighted average diluted shares in the first quarter were 24,391 million, against 24,611 million a year earlier, a net reduction of 220 million, or 0.9%, a comparison that predates the third-quarter buybacks.
How the NVDA Share CFD and Nasdaq 100 Reacted
Nvidia shares fell 0.44% in the regular session on Tuesday, 17 November 2026, before the results appeared after the closing bell. Reports published on 18 November differed on the after-hours move, one putting the rise at about 4% and another at about 2%. Neither is a closing price, since after-hours trading runs on thinner volume. This reaction is history, and past performance is not a reliable indicator of future results; the daily price history around the release appears on the Nvidia chart.
How Nvidia earnings affect the Nasdaq 100 depends on two numbers: the share's percentage move and its index weight. The Nasdaq 100, an index of large non-financial Nasdaq-listed companies, uses index weighting by market capitalisation, the share price multiplied by shares outstanding, subject to capping rules. A constituent's contribution is its weight multiplied by its move, so each percentage point of weight turns a 4% move in Nvidia into 0.04 percentage points of index change, and a 2% move into 0.02. The same arithmetic applies to the S&P 500, and the reasons the two weights differ follow from how the Nasdaq 100 differs from the S&P 500.
The index effect is not confined to Nvidia's own weight. Results that describe hyperscale demand can move the shares of chip suppliers and cloud providers in the same index, so the total index reaction can exceed Nvidia's direct contribution or offset it. The index level and its intraday path are shown on the Nasdaq NAS100 chart.
A share CFD, or contract for difference, pays the change in the price of a share without the holder owning it, so its value follows the underlying. Whether it is quoted outside the exchange's regular hours depends on the provider's trading schedule for that instrument; where it is not, an after-hours move appears as a gap at the next quote. Position size is expressed in shares or lots, as lot size and position sizing for NVDA shares sets out.
Consider, as an illustration, a 50-share NVDA CFD position. Its value changes by 50 multiplied by the change in the share price, so a 4% move equals 50 × 0.04, or two shares' worth of value, and a 2% move equals one share's worth. On a rise of that size, a long position would have gained that amount and a short position would have lost it. The size of the reported move matters as much as its direction, and the two reports differ by a factor of two.
Because a CFD is traded on margin, the deposit that keeps the position open is only a fraction of its value, so leverage magnifies losses on an NVDA position in the same proportion as it magnifies gains. Around an earnings release, losses can build quickly because the price can gap past a stop-loss order between sessions, and a trader can lose all the money deposited in the account. As equity falls, a margin call warning comes first and, lower still, a stop out at which positions close automatically, as how maintenance margin works describes.
Nvidia Earnings Next to the Fed and Treasury Yields
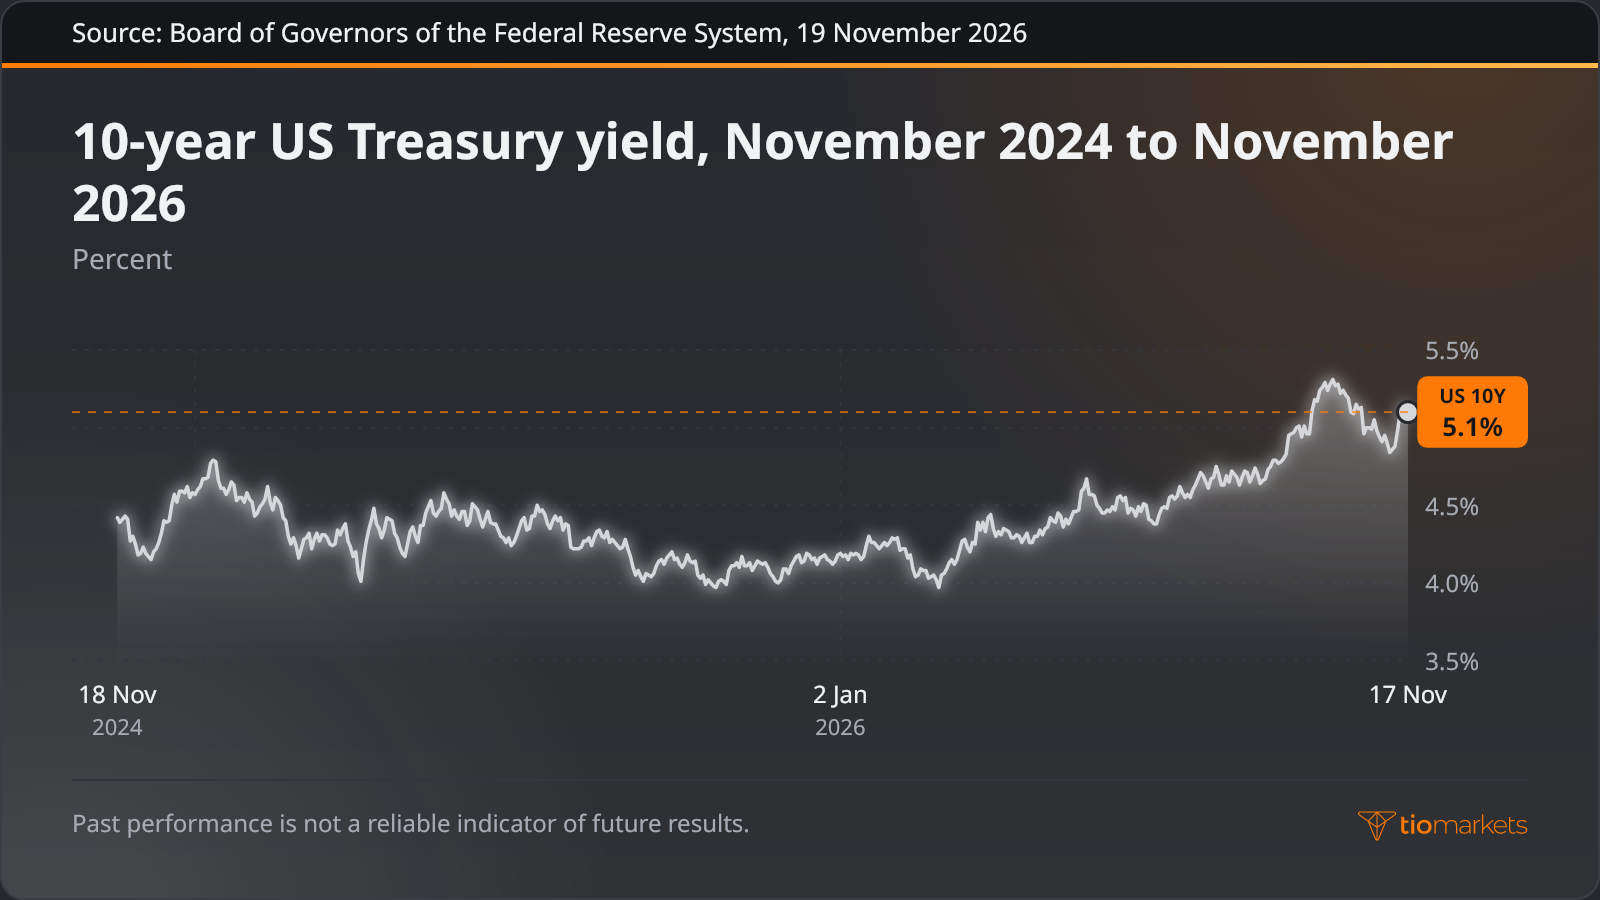
A single company's report is one of several forces acting on the Nasdaq 100, and usually not the broadest. Nvidia earnings arrive four times a year and reach the index through one weight and through related shares. Federal Reserve decisions, US consumer price index (CPI) releases and the 10-year Treasury yield act on every constituent at once by changing the rate at which future earnings are discounted: a higher rate lowers their present value, and a lower one raises it.
Companies whose value rests on profits further in the future are more sensitive to that discount rate, and much of the technology-heavy index fits that description. The 10-year Treasury yield stood at 5.1% on 17 November 2026, the day of the release, while the effective federal funds rate, the overnight rate steered by the Federal Reserve's policy target, was 3.88% in October 2026. The yield is repriced in every trading session and bears on every constituent's valuation, whereas Nvidia's results arrive once a quarter.
The four drivers differ in how often they occur, how far across the index they reach and when the reaction appears in prices:
| Driver | How often | Reach across the Nasdaq 100 | When it shows in prices |
| Nvidia earnings | Quarterly, with each fiscal-quarter result | One constituent's weight, plus related chip and cloud shares | After the US close in after-hours trading; in the cash index at the next open |
| FOMC decision | At scheduled meetings through the year | All constituents, through policy rates and discount rates | On announcement during the US session, then through rate expectations |
| US CPI | Monthly | All constituents, through expected policy rates and yields | At release before the US cash open, first in index futures |
| 10-year Treasury yield | Continuous; official daily series | All constituents, most for long-duration growth valuations | Continuously through each trading day |
Set side by side, the drivers put the earnings effect in proportion. An 8.1% EPS surprise acts on one large constituent and its neighbours, whereas a change in the discount rate reprices all of them, so a CPI print or a Fed decision in the same week can outweigh the earnings effect in either direction.
What to Watch After the Nvidia Earnings Release
Several scheduled disclosures follow the release, each adding information of its own:
- Form 10-Q: the quarterly report filed with the Securities and Exchange Commission, which carries the full financial statements, notes and risk disclosures behind the press release.
- Next earnings date: the fourth-quarter and full fiscal 2027 results, whose date Nvidia publishes on its investor relations website, covering a quarter with an additional week.
- Hyperscaler capital expenditure: the large cloud providers' own quarterly disclosures of spending on data centres, the demand behind the Hyperscale sub-market.
- Fed decisions and US inflation data: FOMC rate decisions and CPI releases, which set the discount-rate backdrop for the whole index.
Conclusion
Nvidia's third quarter shows why a headline beat is only the first line of a results release. Revenue measured demand concentrated in one platform, with Data Center at 92.9% of the total; gross margin measured pricing against cost; and the two EPS figures differed by adjustments the company chooses and redefined this fiscal year. The $28.1 billion returned to shareholders measured how much of $43,777 million of free cash flow left the company. The market's response has to be read against guidance, 4.2% above consensus at its midpoint, and its route into the Nasdaq 100 runs through Nvidia's own weight and related chip and cloud shares, although the reports give no figure for the index move itself.
Each of these readings has limits. Consensus figures differ by provider, after-hours prices are thin and were reported differently, and one quarter's reaction is history rather than a guide to the next. Guidance is the company's own statement, not an outcome. For traders holding leveraged CFD positions through a release, leverage magnifies losses as well as gains, a gap at the next open can make losses build quickly beyond a planned exit, and the entire amount deposited can be lost.
Symbols in this article



Trade from anywhere with the TIOmarkets Trading and Investing Mobile App
Trade over 950 instruments with built-in TradingView charts and competitive spreads, all from your phone, in real time.
Trading is risky
FAQ
Risk disclaimer: CFDs are complex instruments and come with a high risk of losing money rapidly due to leverage. You should consider whether you understand how CFDs work and whether you can afford to take the high risk of losing your money. Never deposit more than you are prepared to lose. Professional client’s losses can exceed their deposit. Please see our risk warning policy and seek independent professional advice if you do not fully understand. This information is not directed or intended for distribution to or use by residents of certain countries/jurisdictions including, but not limited to, USA & Countries included in the OFAC sanction list. The Company holds the right to alter the aforementioned list of countries at its own discretion.
TIOmarkets offers an exclusively execution-only service. The views expressed are for information purposes only. None of the content provided constitutes any form of investment advice. The comments are made available purely for educational and marketing purposes and do NOT constitute advice or investment recommendation (and should not be considered as such) and do not in any way constitute an invitation to acquire any financial instrument or product. TIOmarkets and its affiliates and consultants are not liable for any damages that may be caused by individual comments or statements by TIOmarkets analysis and assumes no liability with respect to the completeness and correctness of the content presented. The investor is solely responsible for the risk of his/her investment decisions. The analyses and comments presented do not include any consideration of your personal investment objectives, financial circumstances, or needs. The content has not been prepared in accordance with any legal requirements for financial analysis and must, therefore, be viewed by the reader as marketing information. TIOmarkets prohibits duplication or publication without explicit approval.
Join us on social media


Authors BIO

Behind every blog post lies the combined experience of the people working at TIOmarkets. We are a team of dedicated industry professionals and financial markets enthusiasts committed to providing you with trading education and financial markets commentary. Our goal is to help empower you with the knowledge you need to trade in the markets effectively.