


Fair Value Gap Strategy: How to Trade FVGs
BY Eleni Antoniou
|October 29, 2026A fair value gap (FVG) is a 3-candle pattern indicating an imbalance in price action. This is a zone where price moves so quickly in one direction that the first and third candles in the pattern do not overlap. Traders who use a fair value gap strategy may treat that gap as a zone of interest when planning their entry and stop levels.
What Is a Fair Value Gap (FVG)?
A fair value gap is a 3-candle pattern formed in a volatile market where the wicks of the first and the third candles don't overlap. The gap between the two candles is the FVG - which forms when a strong directional move creates an imbalance where buyers and sellers do not overlap.
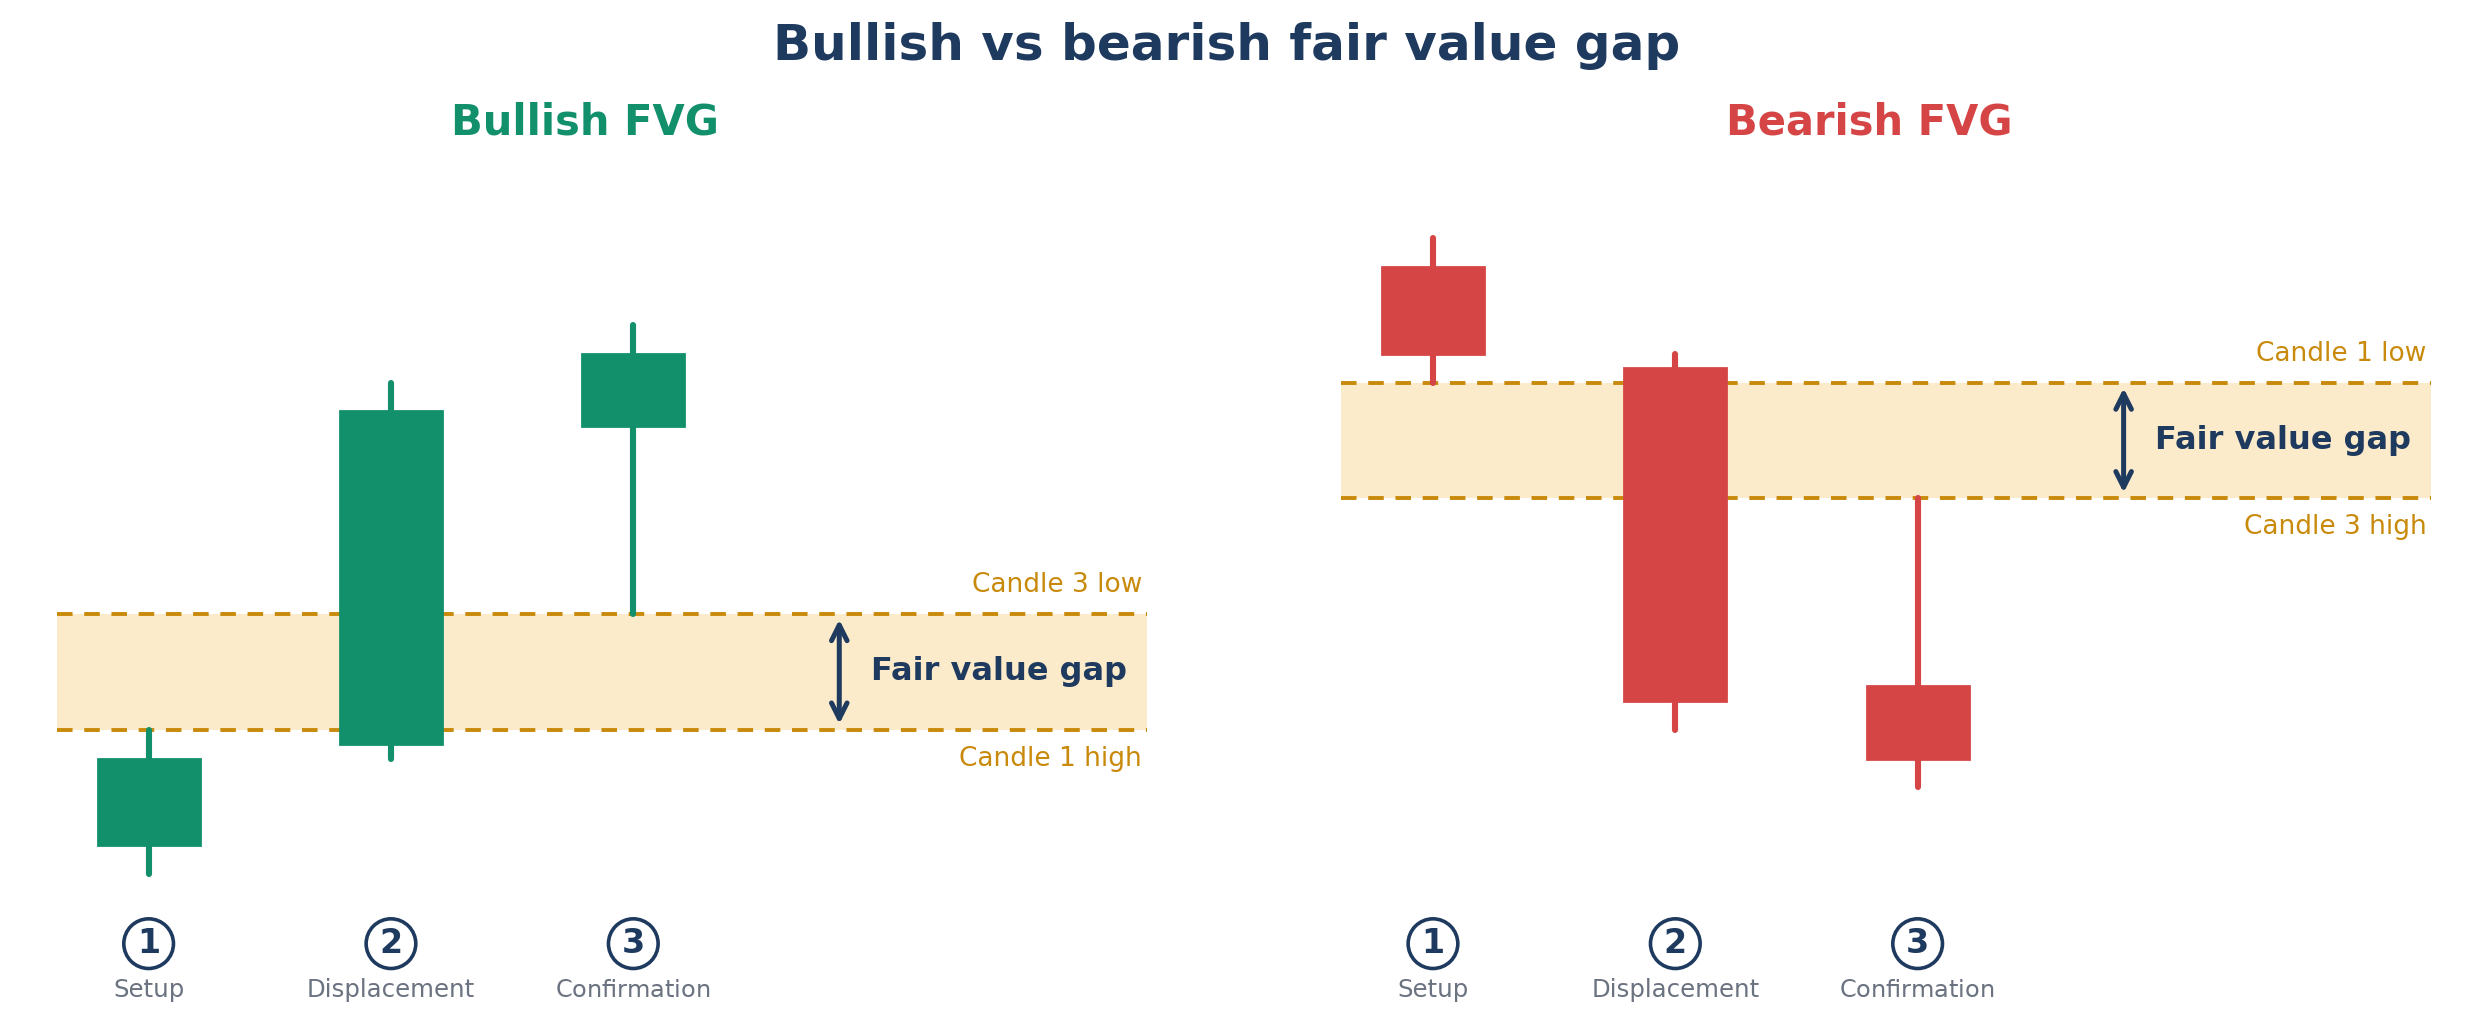
In a fair value gap, the middle candle is large and moves strongly in one direction. The middle candle by itself isn’t the FVG. If the high of the first candle sits below the low of the third candle, a bullish FVG is left between those two prices. If the low of the first candle sits above the high of the third candle, a bearish FVG is left. The gap is the zone between those two prices, not the body of the middle candle.
Why Do Fair Value Gaps Form?
A fair value gap forms when price moves faster than the market can trade at every level in between. Common triggers include:
- Economic news: inflation reports, jobs data and central bank decisions can cause sudden buying or selling, and price may skip through levels within seconds.
- Shifts in sentiment: geopolitical events, surprise announcements or rumours can push many traders to act at once and in the same direction.
- Order-flow imbalance: when buyers or sellers briefly overwhelm the other side, price accelerates and trades only briefly at some levels. This is the idea behind the theory that an FVG marks an imbalance.
- Earnings surprises: a large beat or miss can trigger sharp moves in single-stock CFDs, although these often appear as price gaps at the open rather than as FVGs within a session.
Note that an FVG is not a direct measure of supply and demand.
FVG vs Price Gap
A fair value gap is not the same as a price gap. A price gap, such as a weekend gap, appears between trading sessions and leaves visible space between candles. An FVG forms during continuous trading, in periods of heightened volatility and the candles may still touch each other. The imbalance appears when you compare the first and third candles and put them in context.
How to Identify a Fair Value Gap on a Chart
A fair value gap requires a sequence of three candles, with no overlap between the wicks of Candle 1 and Candle 3. In a bullish FVG, the low of Candle 3 does not reach the high of Candle 1, while in a bearish FVG, the high of Candle 3 does not reach the low of Candle 1.
| Bullish FVG | Bearish FVG | |
| Middle candle | Strong move up | Strong move down |
| Gap zone | Between the high of candle 1 and low of candle 3 | Between the low of candle 1 and high of candle 3 |
| Typical use | Pullback entry in an uptrend | Pullback entry in a downtrend |
| Invalidation | Candle closes below the whole gap | Candle closes above the whole gap |
Here’s how you can identify a bullish or bearish FVG:
Select the Timeframe
FVGs form on any chart, but they behave differently on different timeframes. Use timeframe analysis to identify the most significant reference points for overall bias and broader market structure. Lower timeframes have frequent gaps, but they are often short-lived, and form less frequently on higher timeframes.
Identify the 3-Candle Structure
A fair value gap comprises three consecutive candles:
- Candle 1 (The Setup Candle): This is the candle preceding a strong momentum candle. The high (in a bullish FVG) or low (in a bearish FVG) marks the first boundary of the fair value gap.
- Candle 2 (The Displacement Candle): It’s the candle with a significantly stronger momentum - indicating order imbalance.
- Candle 3 (The Confirmation Candle): Forms after the volatile candle and crucially, its wick doesn’t retrace far enough to overlap with Candle 1.
Mark the Price Imbalance on the Chart
For a Bullish FVG, draw a rectangle from the high of the first Candle’s wick to the low of the third Candle's wick.
For a bearish FVG, draw a rectangle from the low of the first candle’s wick down to the high of the third candle’s wick.
This highlighted box is the fair value gap.
Confirm the Gap
Confirming can help validate if an FVG has active support or resistance level. Generally, check if the price action retraces back into the gap. Does the gap partially or fully fill? Does the price action overshoot and then reverse? These patterns could help identify a potential trend continuation, FVG invalidation, or liquidity sweeps.
While a fair value gap requires three candlesticks to complete the pattern, not every three-candle sequence on a chart with a gap qualifies as an FVG. The middle candle must show genuine momentum - either bullish or bearish.
How to Trade Fair Value Gaps
Most fair value gap trading strategies are anchored on a return-to-fill idea - the price action tends to retest the gap before trend continuation. The return-to-fill thesis isn’t seen as a trend reversal, but as price revisiting a zone of imbalance it may have skipped earlier.
This is a hypothesis traders test, not a rule. The four steps below turn it into a plan with a defined entry and stop loss.
Step 1: Set the Directional Bias
Once you’ve identified a fair value gap on a chart, check the trend on a higher timeframe first. Consider bullish gaps in uptrends and bearish gaps in downtrends, and treat a gap that runs against the higher-timeframe trend as a structurally weaker setup.
Step 2: Wait for price to retest the gap, and watch what it does
Avoid opening a position as soon as the gap forms. FVG trading strategies rest on return-to-fill thesis. There are three things to watch out for here:
- Partial fill: price enters the gap but reverses before fully filling the FVG. The gap stays active provided the price pullback doesn’t fully cover it.
- Full fill: Price retraces through the entire FVG. A wick through the zone doesn’t invalidate it on its own; many traders wait for a close beyond the FVG.
- Overshoot and reclaim: price fully fills and briefly breaks out of the FVG, then reverses back into the zone. ICT theory describes this as a liquidity sweep, while others simply see a failed break.
Step 3: Choose an entry approach
For FVG strategies, price retraces into the gap, reacts, and then continues in the direction of the prior trend. The reaction is what most traders look for, not the first touch of the zone. To add context, pair the gap with support and resistance analysis. A gap that lines up with a higher-timeframe level, such as a previous day’s high or low, may carry more weight than one in open space.
Depending on your risk profile, your entry could be:
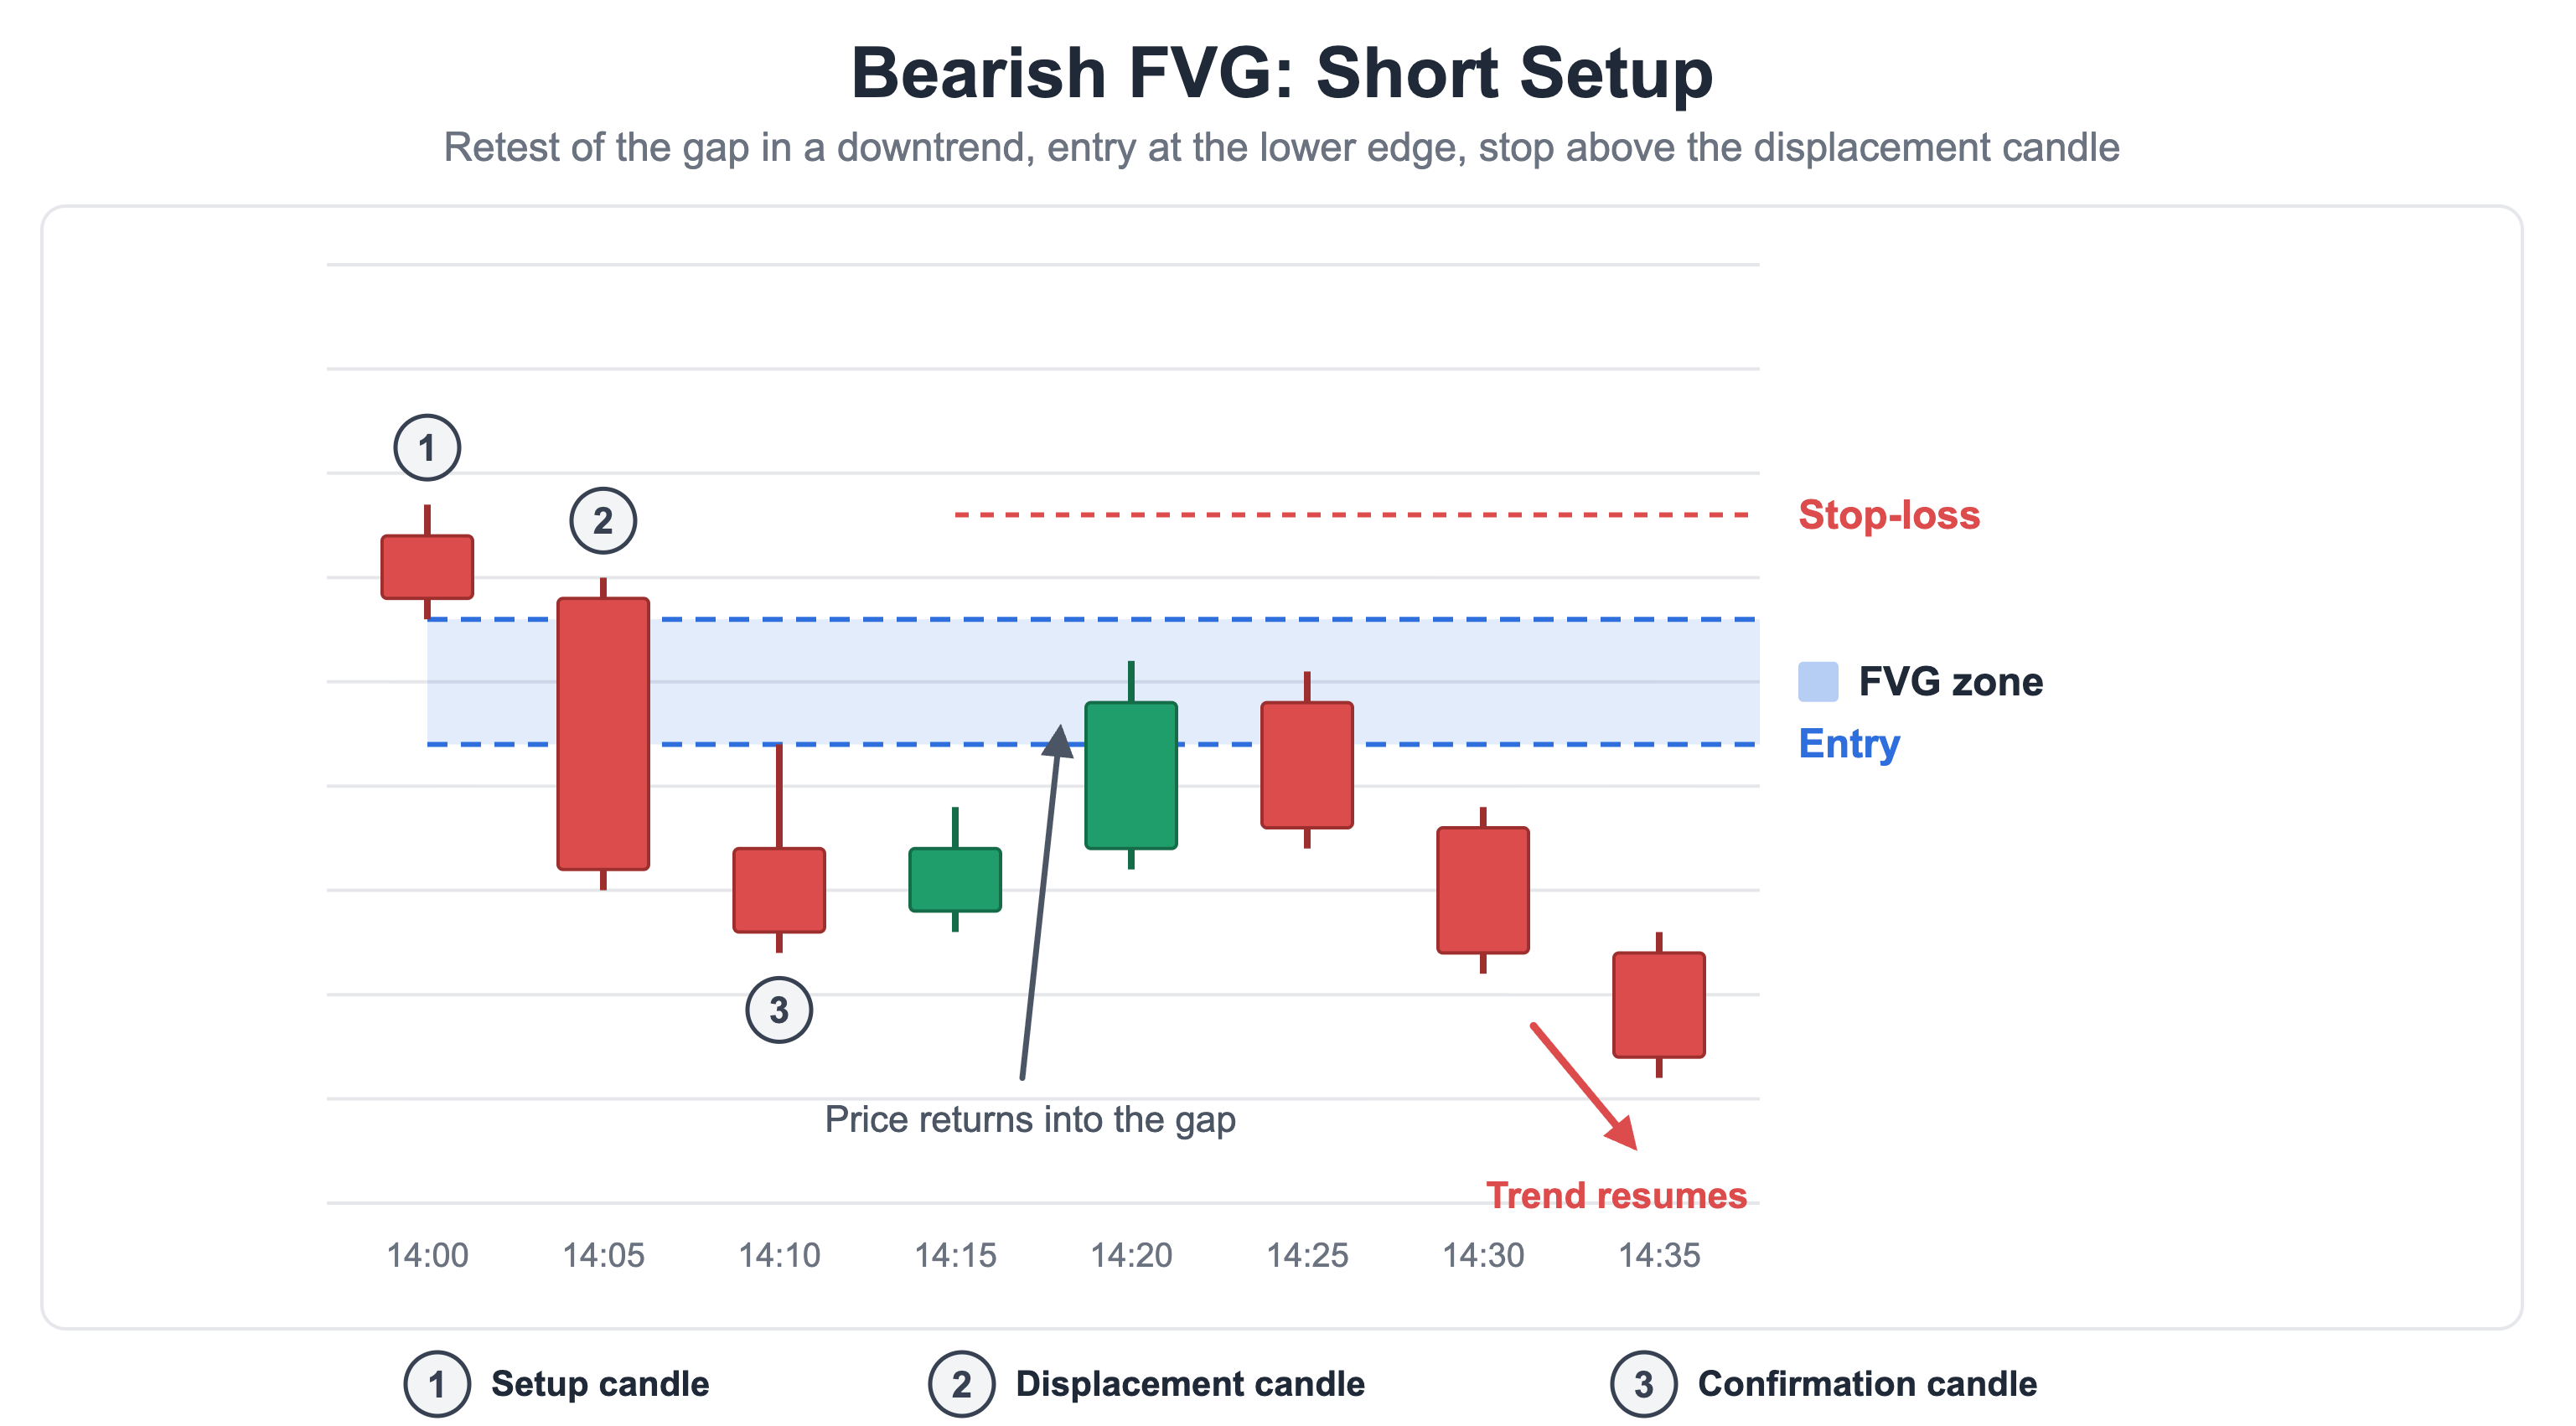
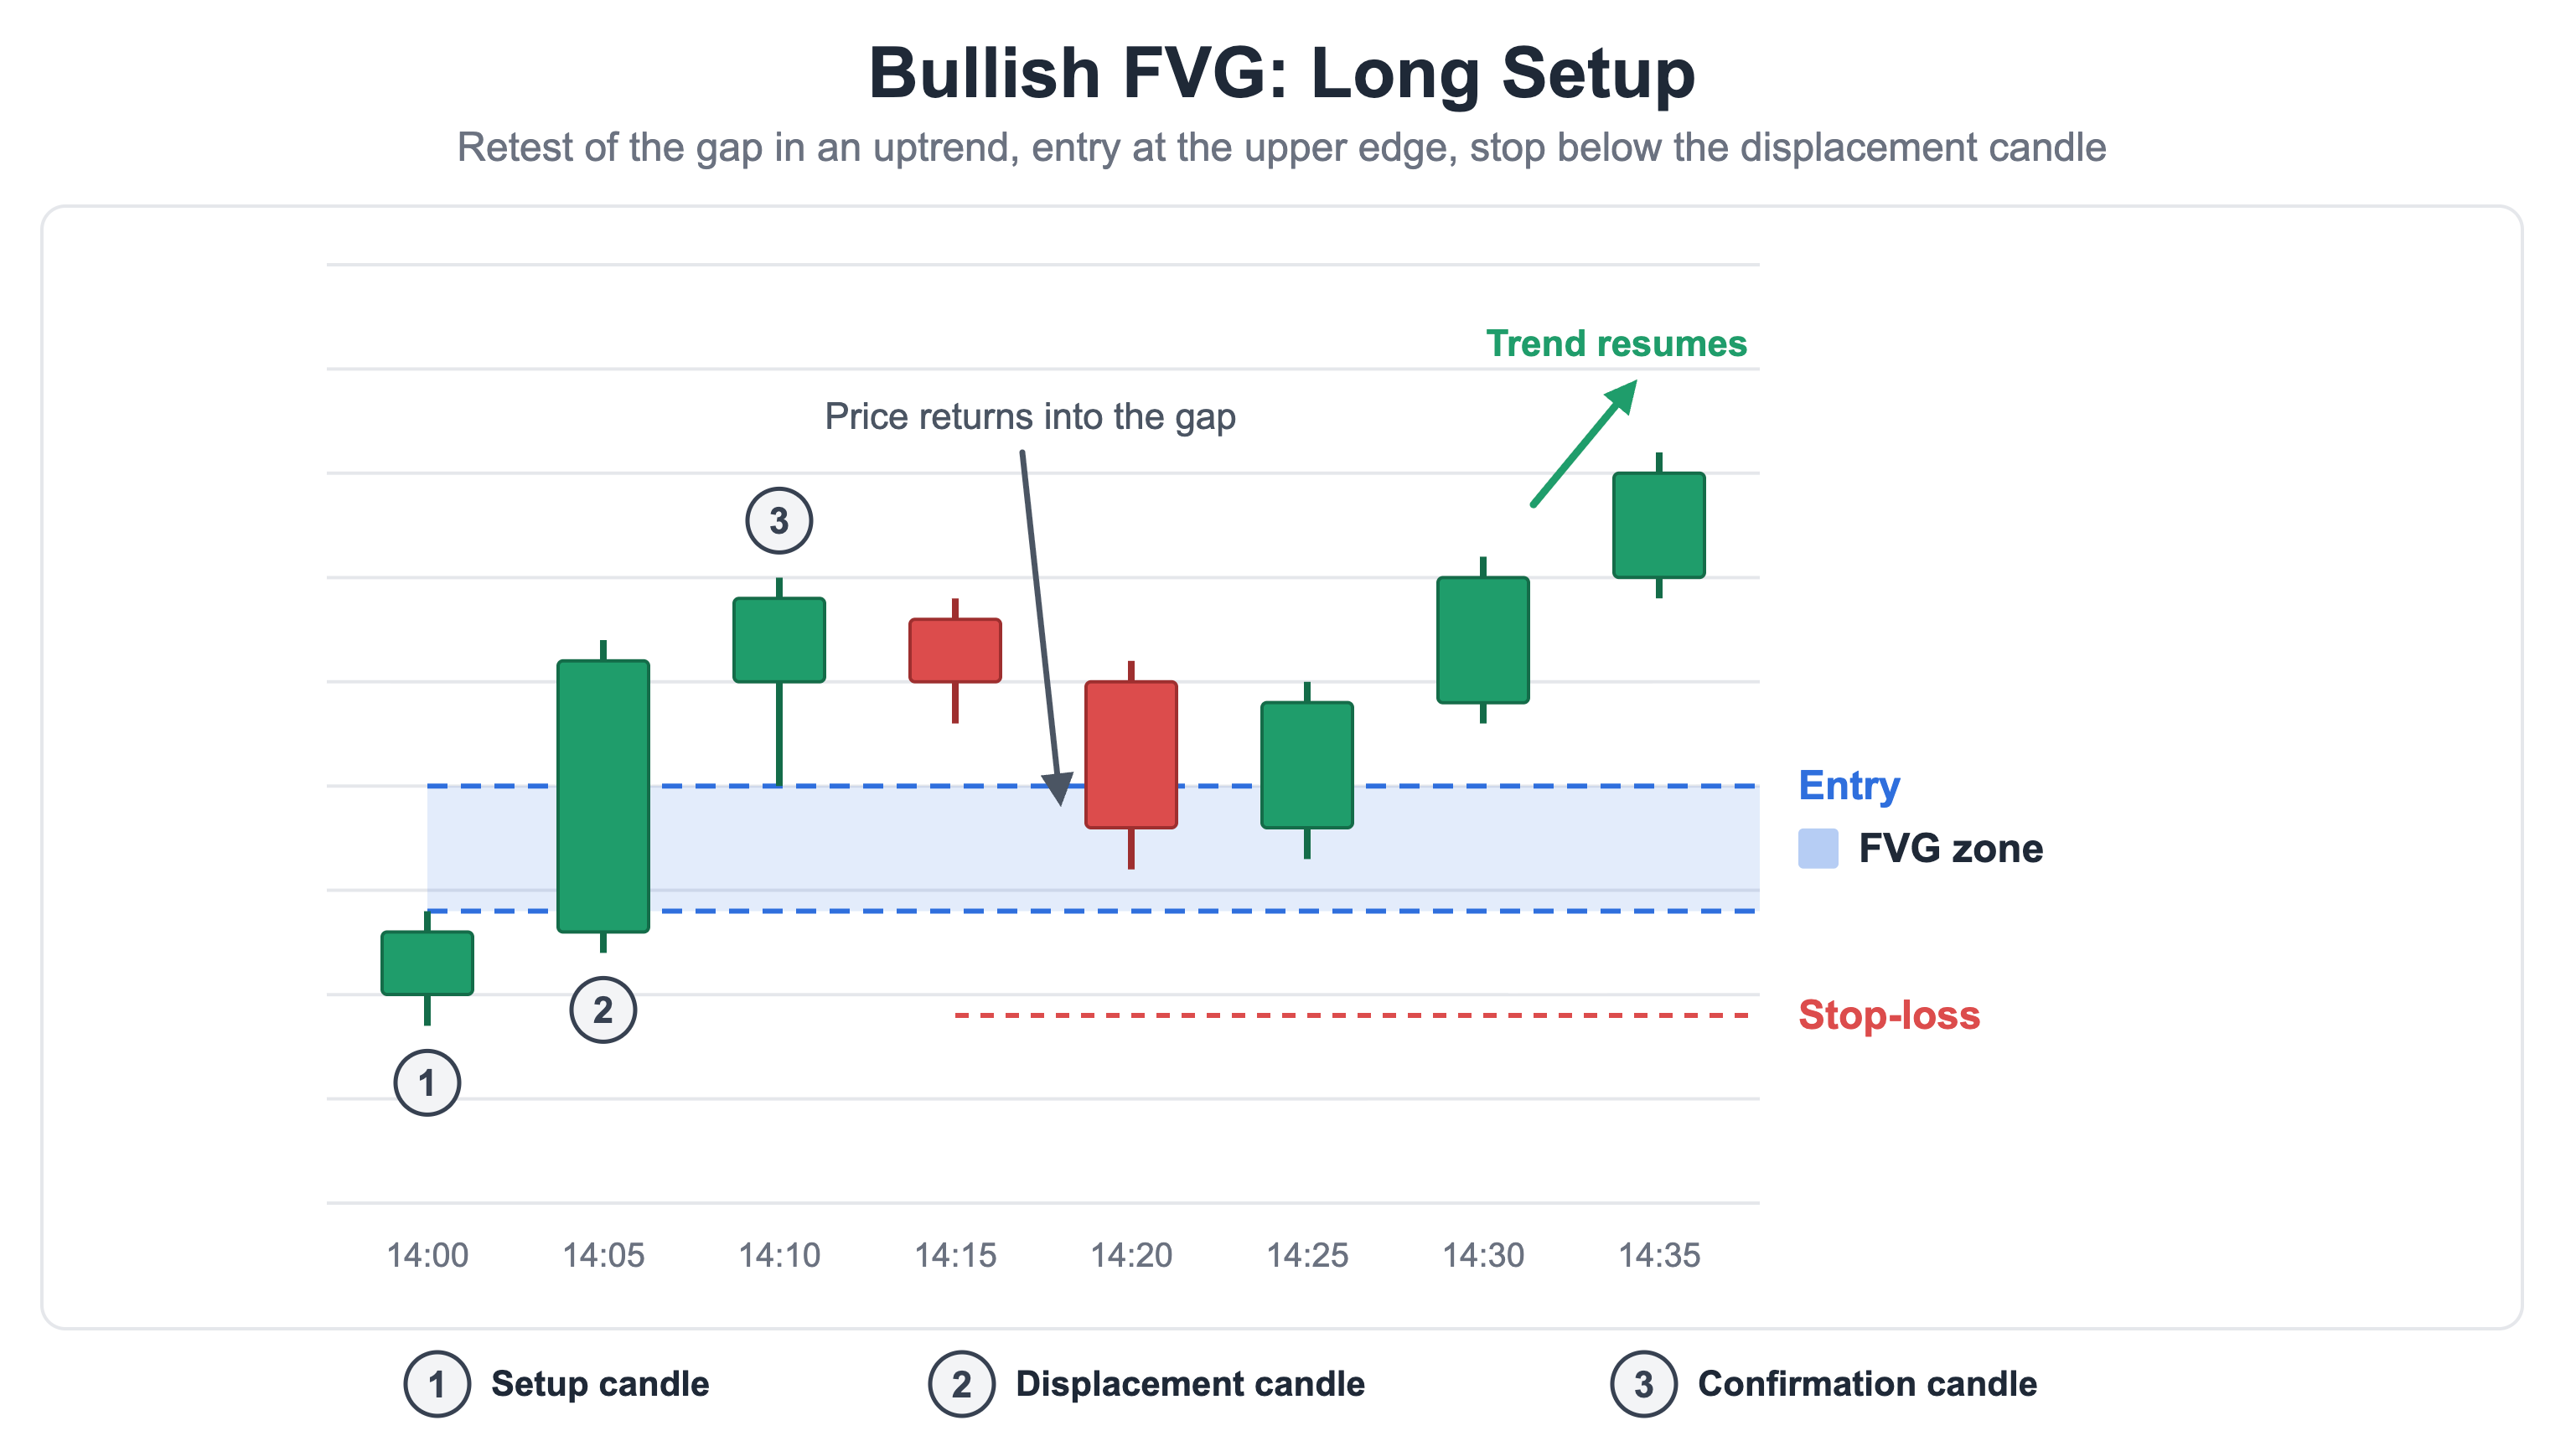
- Edge entry: Around the edge of the gap - upper edge for bullish FVGs and bottom edge for bearish FVGs
- Midpoint entry: Around the 50% retracement of the FVG
Consider waiting for the price action to retrace inside the FVG, before opening a position. Combined with volume and candlestick pattern analysis, you could judge if the fair value gap is live or invalid and help you choose the best entry.
Step 4: Place the stop-loss
Place the stop loss beyond the structural invalidation point of the FVG. For a bullish FVG, this is below the first candle’s low, and above the first candle’s high for a bearish FVG. A candle that overshoots and closes beyond the edges of the fair value gap is generally treated as invalidation.
Fair Value Gap Trading Strategy Examples
Bullish FVG - Long setup
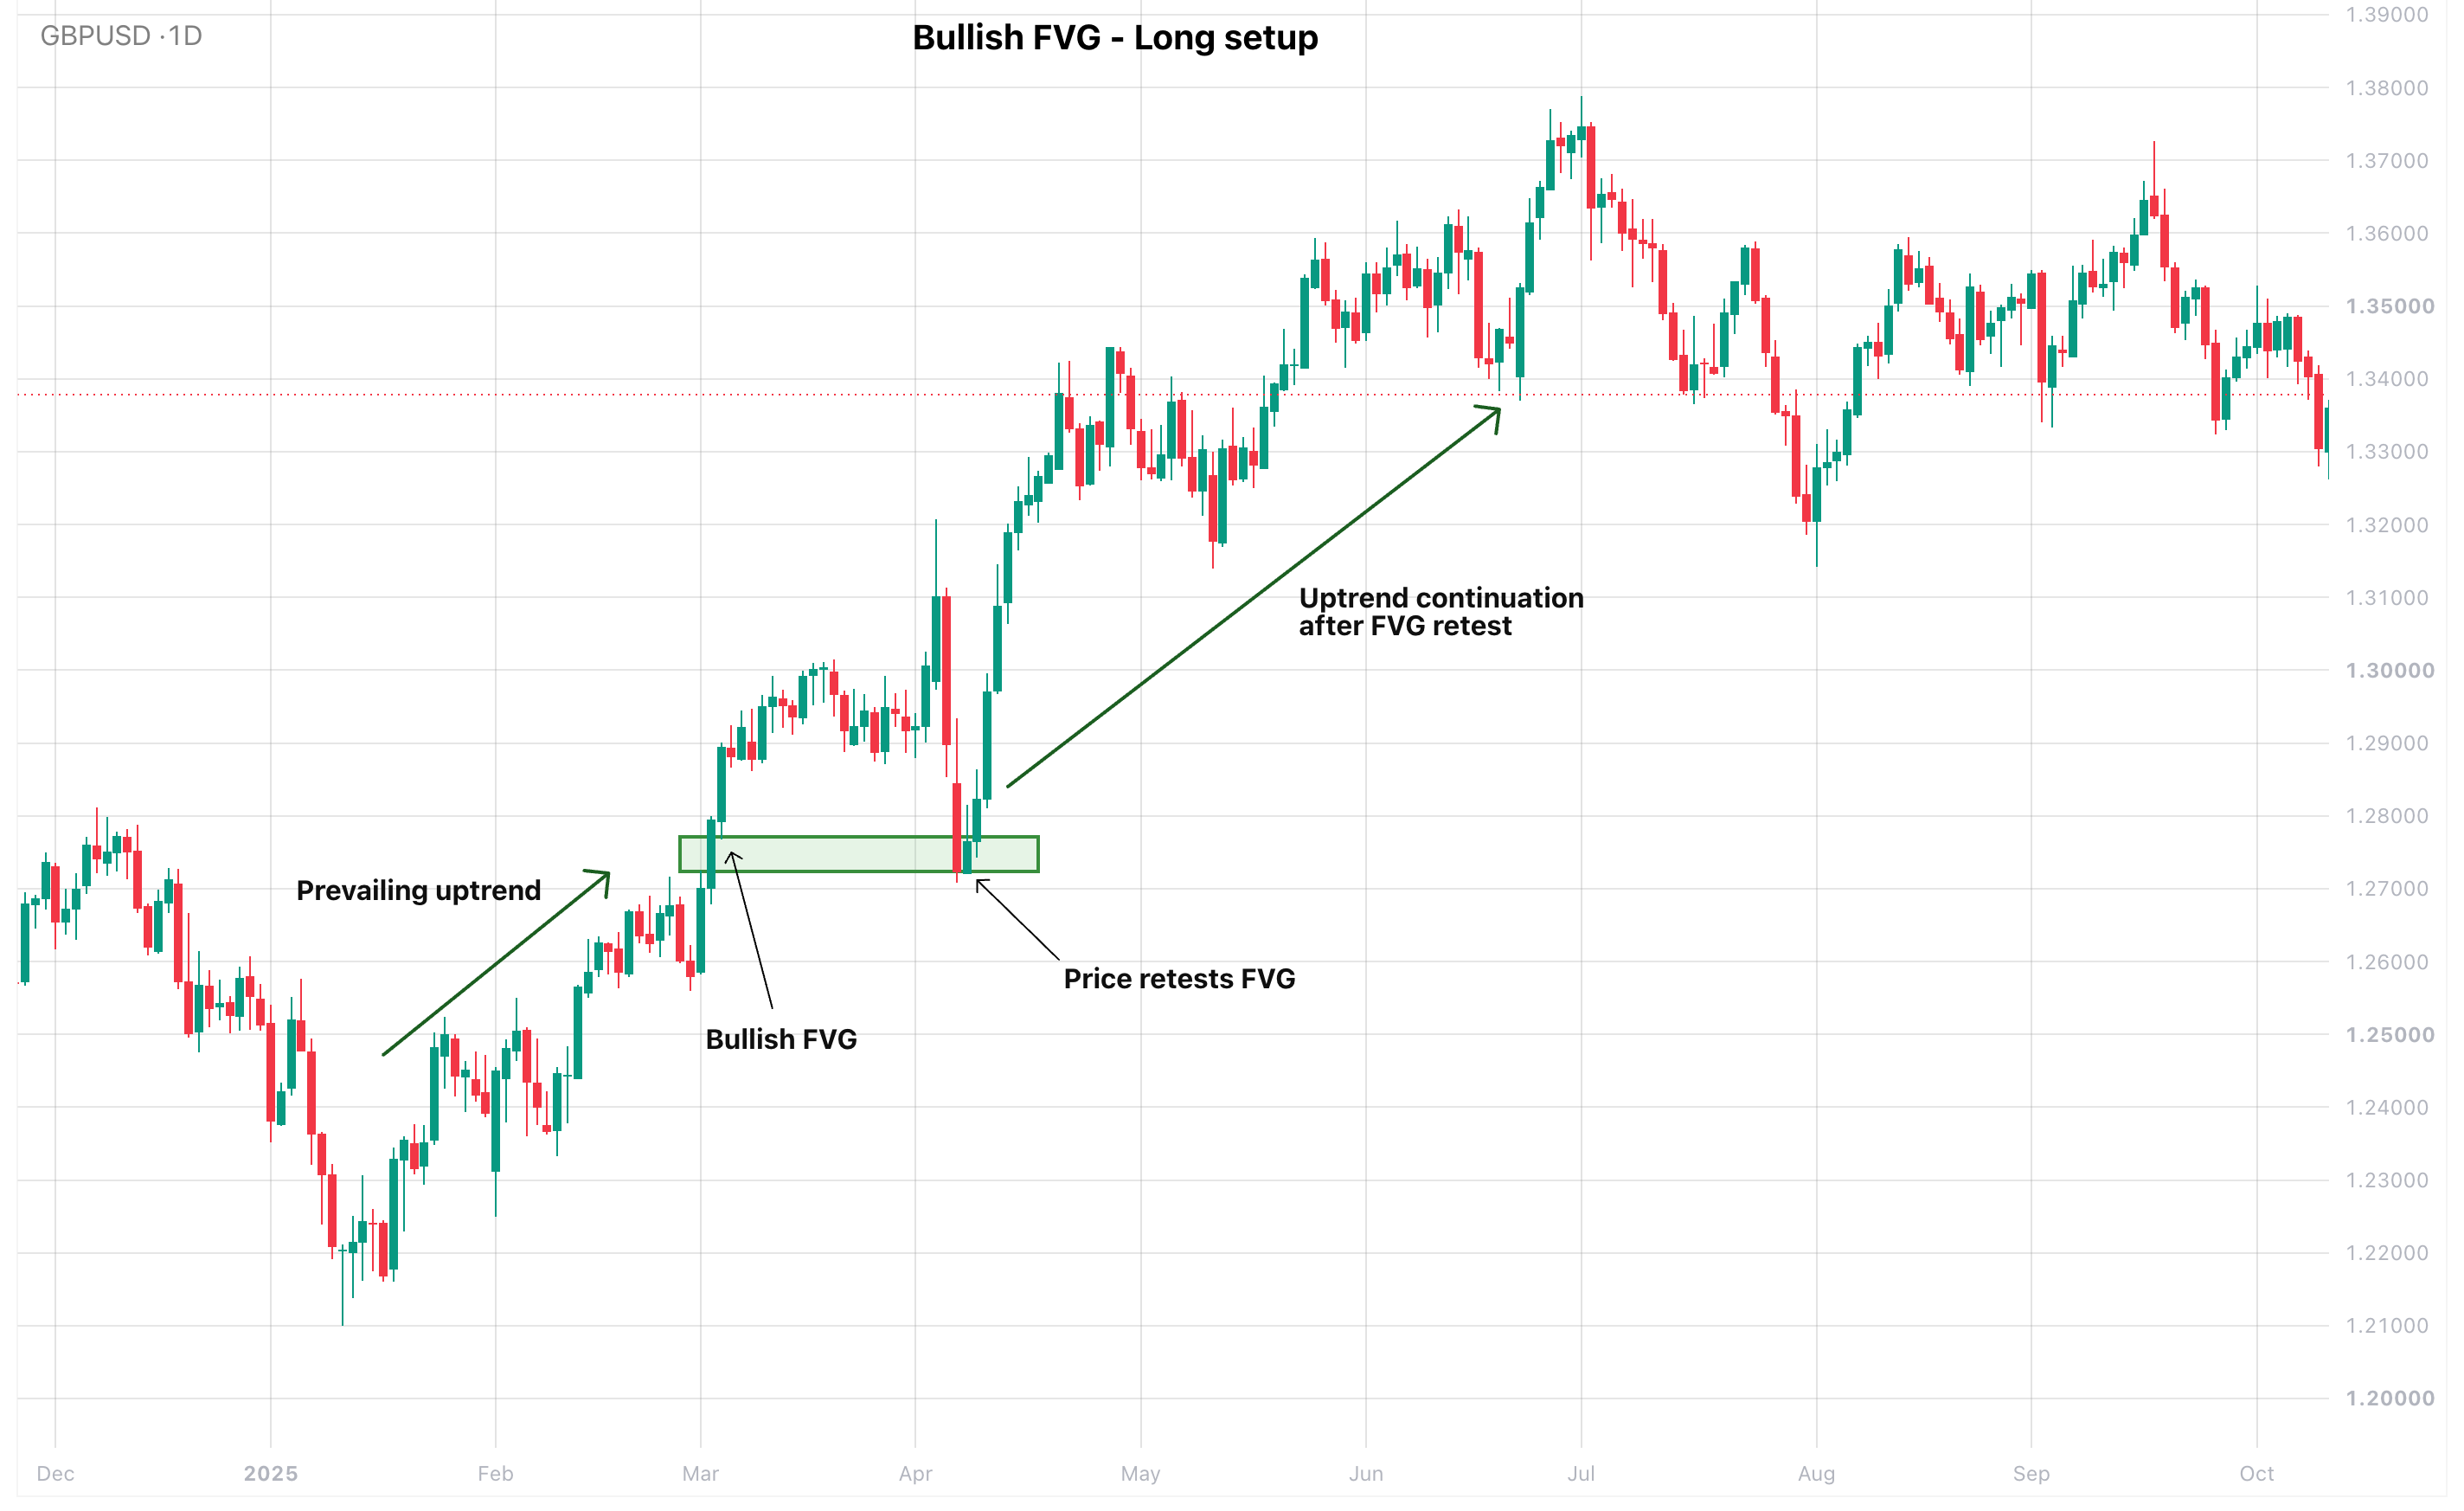
This occurs in an uptrend when a bullish fair value gap is formed, and the price has a retracement into the gap. Traders might consider a long position if price retests the gap and then closes back above its upper edge, resuming the uptrend.
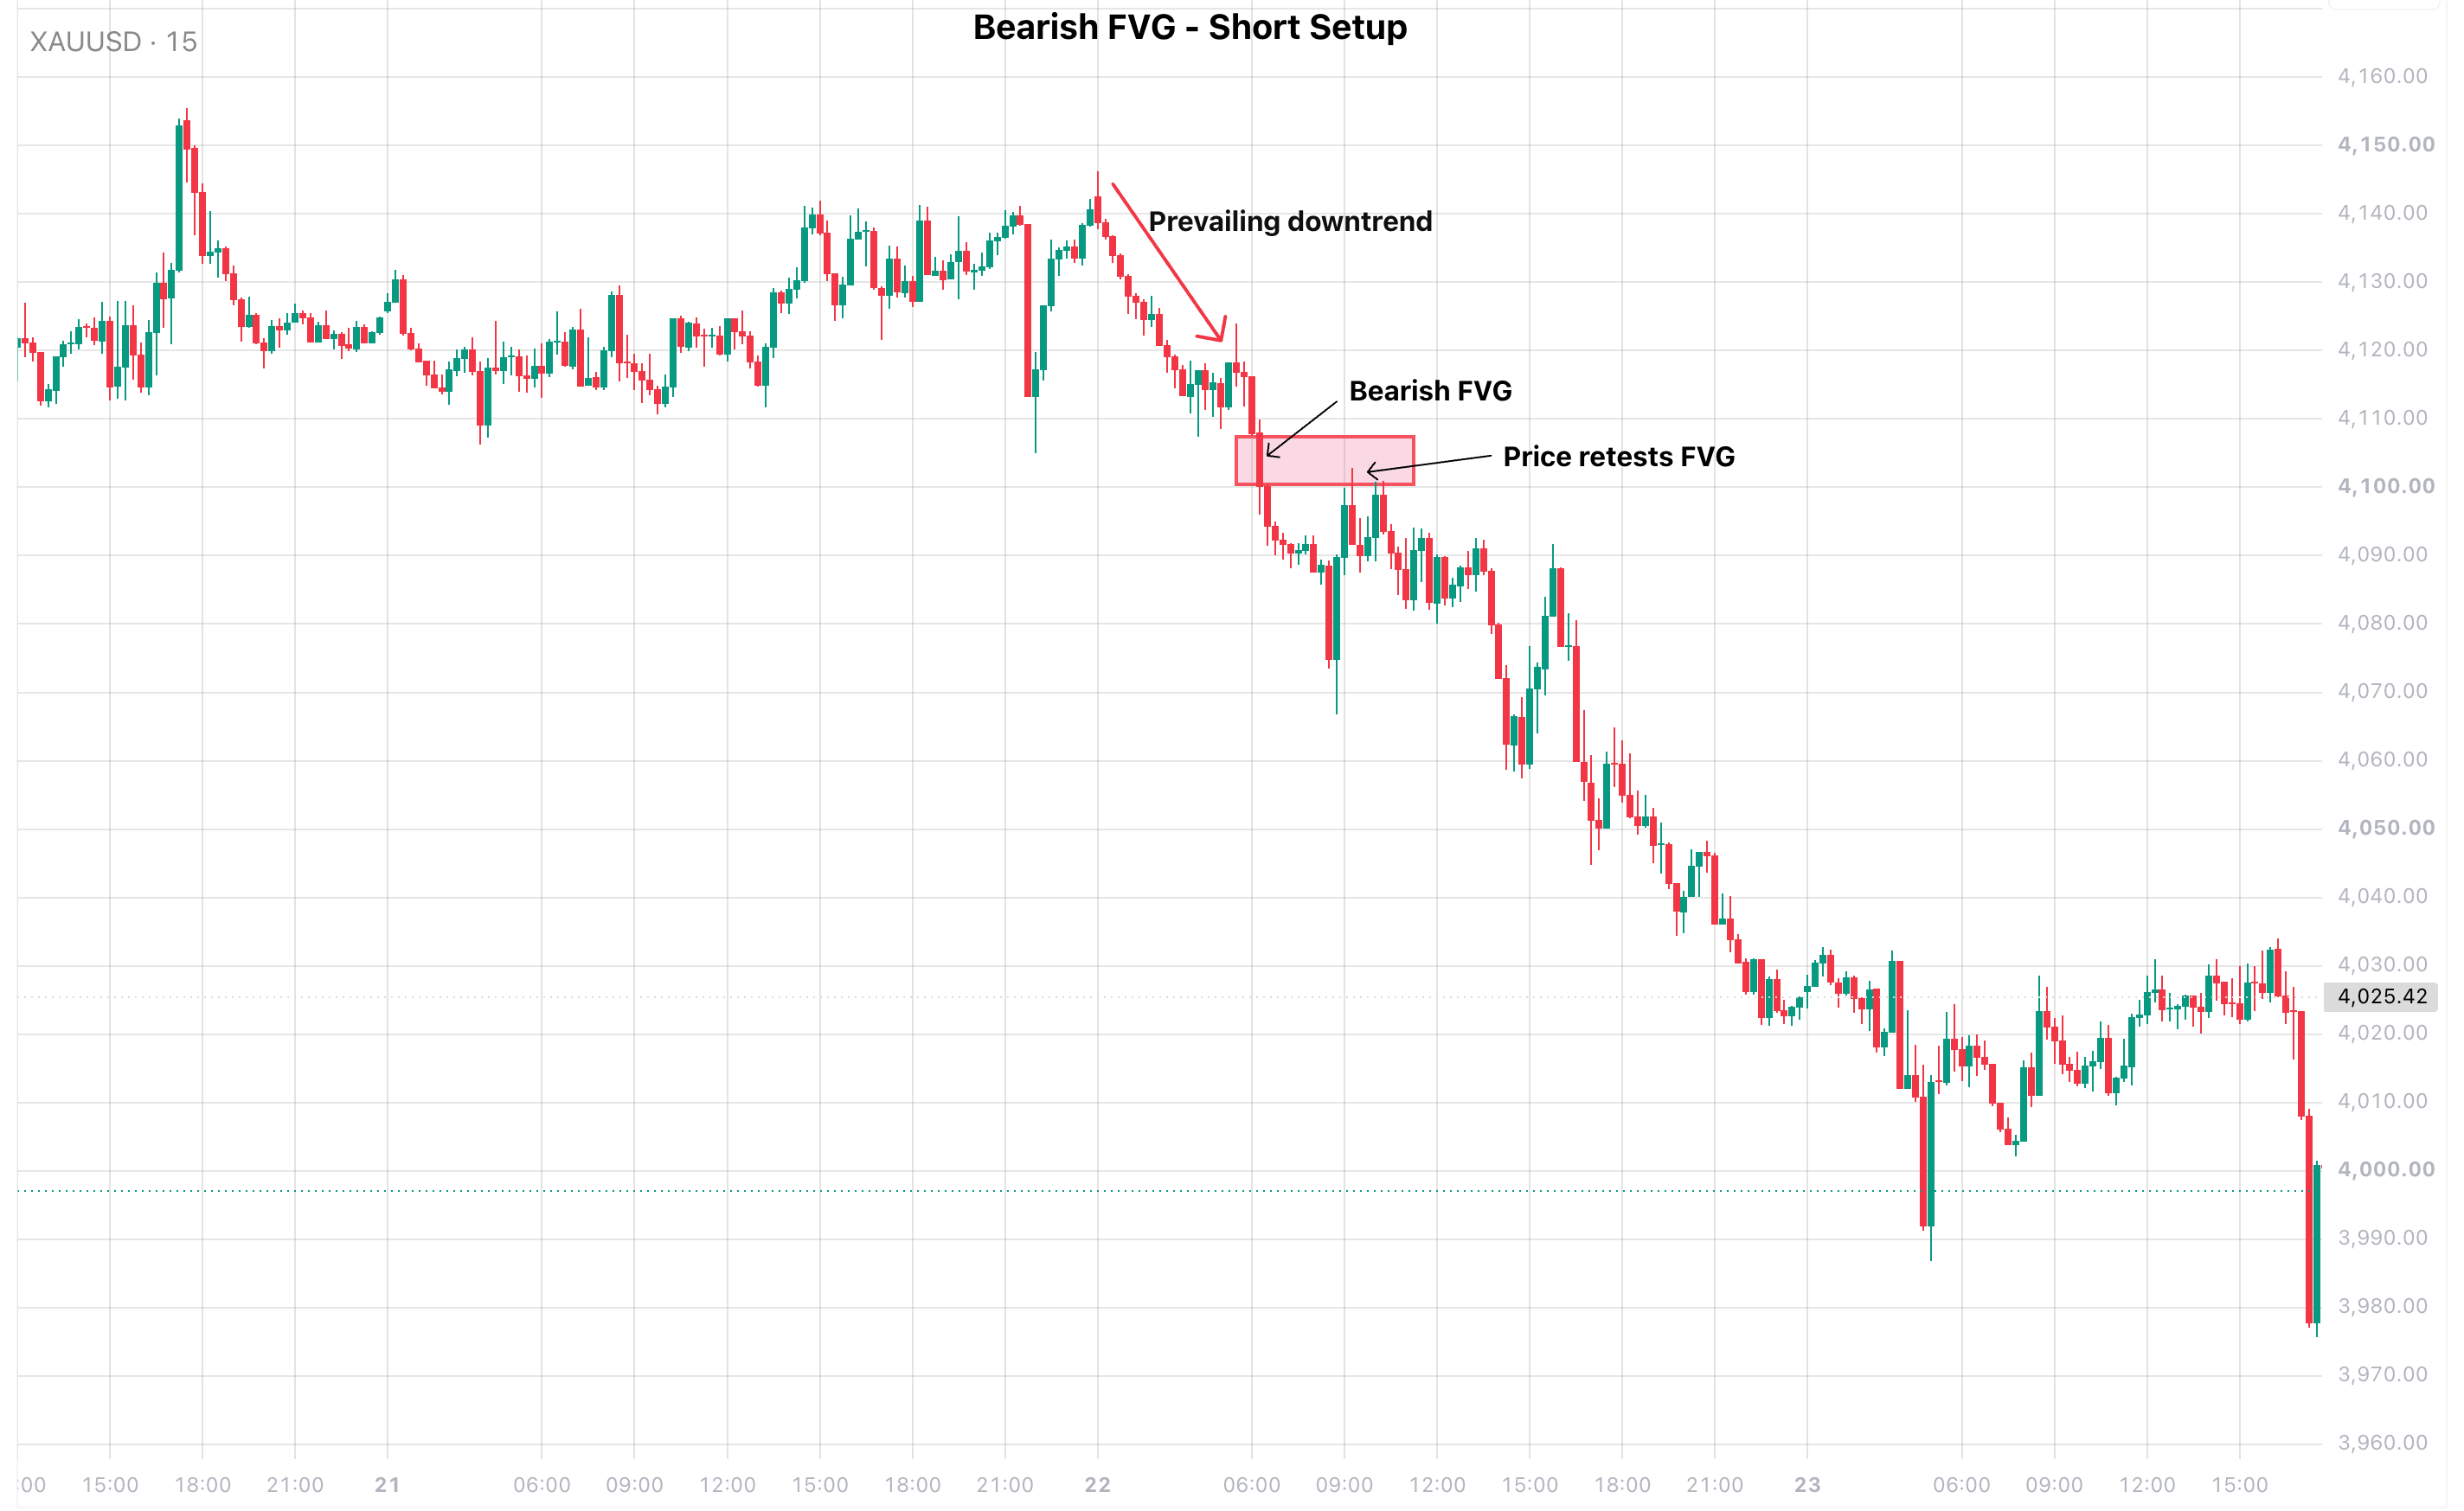
Bearish FVG - Short Setup
This occurs in a downtrend when a bearish fair value gap is formed, and the price retraces into the gap. Traders might consider taking a short position when the price action retests the FVG and closes below the lower zone of the gap, resuming the downtrend.
FVG trading strategy: Pros and Cons
Like any trading strategy, fair value gap trading has its potential risks and opportunities. Weighing both helps you decide whether it suits your trading style and risk management.
Potential advantages
- Defined technical structure: An FVG gives you a visible zone to plan your trade around. Your entry, stop and target can be set before you open a trade rather than improvised in the moment.
- May lower exposure to slippage: Waiting for a retest into the gap, instead of chasing the displacement candle, can help you avoid slippage during heightened volatility, although slippage can still occur.
- Works across multiple assets and timeframes: FVG is a price action pattern and can be used on different asset classes across multiple timeframes.
- Combines well with other analysis: Some traders align an FVG with a recent break of structure (BOS) or an order block (OB) for added context. These are interpretations, not confirmations.
Potential drawbacks
- No guarantee of a retest: Price can leave a gap untouched and continue trending, and you might miss the trade or get caught on the wrong side.
- Gaps can fail: Price may fill the gap completely and reverse, invalidating the setup and triggering your stop.
- Market noise on lower timeframes: Minor gaps form constantly in lower timeframes and often carry little weight.
- Market volatility: Heightened and prolonged volatility may make FVGs unreliable. FVGs form during fast markets, which is also when slippage, wider spreads and sharp reversals are most likely.
Conclusion: How to Trade a Fair Value Gap Strategy
A fair value gap is a 3-candle pattern formed in a volatile market, which makes it relatively easier to spot. The harder part is deciding whether an FVG is actionable, which depends on trend context, a clear invalidation level and sensible risk management. Some traders look for gaps that form straight after a break of structure, or that overlap an order block, because the confluence adds context to the price action.

FAQ
Risk disclaimer: CFDs are complex instruments and come with a high risk of losing money rapidly due to leverage. You should consider whether you understand how CFDs work and whether you can afford to take the high risk of losing your money. Never deposit more than you are prepared to lose. Professional client’s losses can exceed their deposit. Please see our risk warning policy and seek independent professional advice if you do not fully understand. This information is not directed or intended for distribution to or use by residents of certain countries/jurisdictions including, but not limited to, USA & Countries included in the OFAC sanction list. The Company holds the right to alter the aforementioned list of countries at its own discretion.
TIOmarkets offers an exclusively execution-only service. The views expressed are for information purposes only. None of the content provided constitutes any form of investment advice. The comments are made available purely for educational and marketing purposes and do NOT constitute advice or investment recommendation (and should not be considered as such) and do not in any way constitute an invitation to acquire any financial instrument or product. TIOmarkets and its affiliates and consultants are not liable for any damages that may be caused by individual comments or statements by TIOmarkets analysis and assumes no liability with respect to the completeness and correctness of the content presented. The investor is solely responsible for the risk of his/her investment decisions. The analyses and comments presented do not include any consideration of your personal investment objectives, financial circumstances, or needs. The content has not been prepared in accordance with any legal requirements for financial analysis and must, therefore, be viewed by the reader as marketing information. TIOmarkets prohibits duplication or publication without explicit approval.
Join us on social media


Authors BIO

Eleni is a financial markets enthusiast contributing to content covering forex, indices, commodities, and global market developments. She is passionate about researching market-related topics and helping make financial information more accessible to traders.