


Rounding Top Pattern: How to Spot and Read This Reversal
BY Eleni Antoniou
|October 26, 2026Some market tops arrive suddenly. Others build quietly over weeks or months, as buyers lose energy and sellers slowly take control. The rounding top pattern is the chart picture of that slow change.
A rounding top pattern is a bearish reversal pattern shaped like an upside-down U, also called an inverted saucer. It forms after an uptrend. It is confirmed when price breaks and holds below its neckline, the support level beneath the curve.
This guide explains how the shape forms and how to identify it step by step. It covers how volume and the neckline confirm it, and how traders measure it and define risk. It also compares it with similar tops and looks honestly at its limits.
What Is a Rounding Top Pattern?
A chart pattern is a shape that price traces on a chart. Traders study these shapes as part of technical analysis, the analysis of price charts. The rounding top is a reversal pattern. It appears at the end of an uptrend and points to a possible trend reversal, a change from rising prices to falling ones.
Its outline looks like an inverted U or an upside-down saucer, which is why it is also called an inverted saucer. Price rises, levels off in a broad, rounded high, then drifts lower. The curve matters: the top is gradual rather than a sharp spike.
It is the mirror image of the rounding bottom, also known as a saucer. Both shapes trace a slow change in who controls the market. In a rounding top, selling gradually absorbs demand during a quiet distribution stage, and the pattern ends with a decisive move lower. Because these curves need time to develop, many traders miss them.
The shape can appear on charts of currency pairs such as EUR/USD, gold (XAU/USD), stock indices such as the US500 and cryptocurrencies such as BTC/USD. The logic is the same in each. It describes changing supply and demand, not a particular asset.
Anatomy of the Rounding Top Formation: Advance, Peak and Decline
The pattern has three main stages: the advance, the consolidation at the peak and the decline. It also needs an uptrend in place beforehand. If there is no rise to reverse, the shape cannot be a reversal pattern.
- The advance. Price climbs while buyers stay in charge. In an ideal pattern, trading volume, the amount that changes hands, is high at the start of this rise.
- The peak or consolidation. Gains slow and price moves sideways in a broad arc. Volume tends to fall. The high may resemble an inverted V, but a true rounding top avoids a sharp point.
- The decline. Price begins to slide and volume tends to pick up as selling builds. Ideally, this right-hand slide lasts roughly as long as the rise that built the left-hand side.
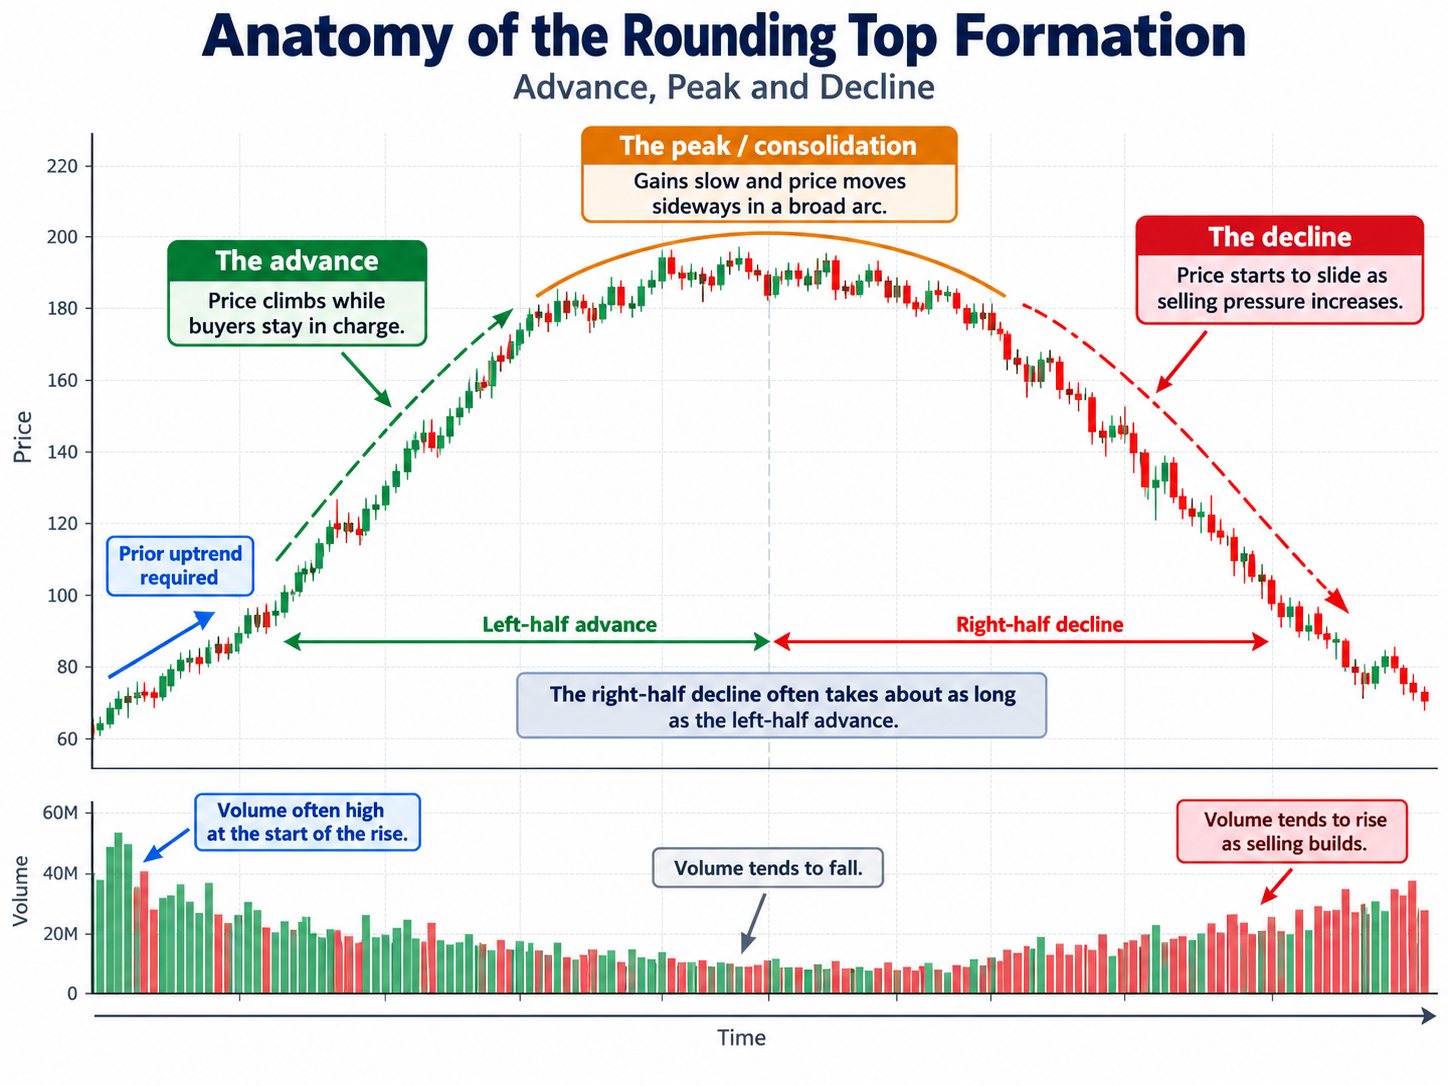
The rounded peak is often linked to a distribution phase. Distribution is the period when holders gradually sell their positions to the remaining buyers. Demand is still there, so price does not collapse at once. But each push higher finds less buying, and the curve slowly bends over.
Put simply, analysts look for three main ingredients:
- a curved price path that climbs, flattens and then falls;
- volume that traces the opposite curve, heavier at the start and end and lighter in the middle;
- a support level along the base, which becomes the neckline.
A support level is a price area where buying has tended to appear and halt declines. On a rounding top, it is drawn across the low points at the base of the curve.
How to Identify a Rounding Top Pattern Step by Step
Spotting this shape is mostly about patience. The steps below follow the order in which it develops.
- Confirm the prior uptrend. Look for a clear run of higher highs and higher lows first. The pattern only makes sense at the end of a rise.
- Watch momentum slow. Gains become smaller, swings grow shallower and price starts to move sideways near the high.
- Check the shape. The top should curve gradually. A sharp, pointed high is more likely a different pattern or simply a spike.
- Mark the neckline. Draw a horizontal line across the support level at the base of the curve.
- Compare the two sides. The decline on the right should take roughly as long as the advance on the left. A very fast drop does not fit the textbook shape.
- Read the volume. Look for high volume early in the advance, lighter volume around the peak and rising volume as price falls.
- Wait for confirmation. The pattern is complete only when price breaks and holds below the neckline. Until then, it is just a possible rounding top.
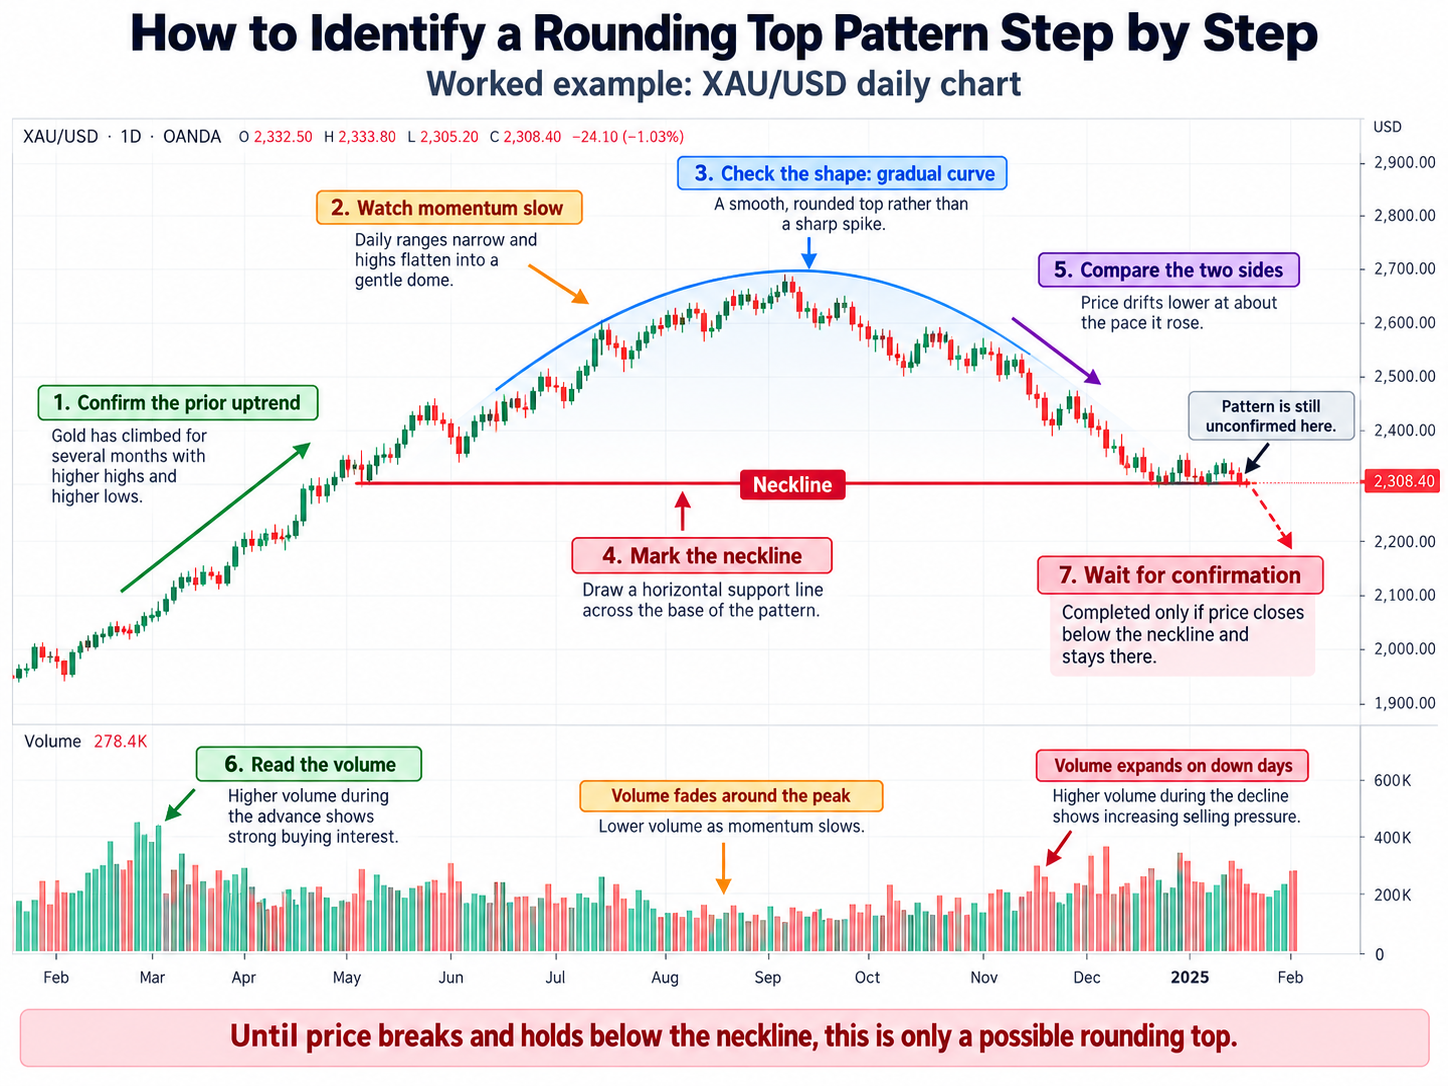
A worked example. Picture a daily chart of XAU/USD. Gold has climbed for several months, with strong volume as the rally began. Over the following weeks, daily ranges narrow and the highs flatten into a gentle dome while volume fades.
Price then drifts lower at about the pace it rose, and volume expands on down days. An analyst would mark the base of the dome as the neckline and note that the pattern is still unconfirmed. It only counts as a completed rounding top if price closes below that line and stays there.
Timeframes, the period each candle or bar on a chart covers, change what you see. Formation time varies widely, from several days to weeks, months or even years. A pattern that needs longer to complete is thought to point to a longer-lasting change in trend. On very short charts, curves are hard to tell apart from normal noise.
Rounding Top Volume Confirmation and the Neckline Breakdown
Shape alone is not enough. Most analysts look for two kinds of evidence: a volume pattern that supports the story, and a break of the neckline.
Volume. In the ideal case, volume runs high as the advance begins, then thins out as the advance ends and price consolidates. It builds again as price declines. The logic is simple: eager buying starts the rise, interest dries up near the top, and selling grows as more holders exit.
Spot forex has no single central exchange, so charting platforms usually show tick volume, a count of price changes, instead of traded volume. Many traders treat it as a rough guide only.
The rounding top neckline breakdown. The neckline is the support line along the base of the pattern. The bearish case firms up in stages. Price first slips below the reaction lows, the small dips on the way down, and finally below the neckline itself. The pattern counts as confirmed only when price breaks the neckline and stays below it, rather than briefly poking through.
The retest. After the break, price sometimes rallies back to the neckline before continuing down. This is called a retest. Old support can act as resistance, a level where selling has tended to appear. A retest is common but not certain, and price can also climb back above the line, which weakens the pattern.
Some traders add other tools for context:
- Moving averages. A moving average plots the average price over a set number of past periods, smoothing out noise. Price slipping below an average it held during the uptrend can add context to a weakening trend.
- RSI divergence. The relative strength index (RSI) measures the speed and size of recent price moves. Bearish divergence appears when price makes a higher high but the RSI makes a lower high, a sign that momentum is fading.
None of these tools is a signal on its own. They are extra evidence to weigh alongside the pattern.
How to Measure a Rounding Top Pattern and Manage Risk
Once a rounding top is confirmed, many analysts estimate how large the move could be in principle. Traders also decide in advance how much they are prepared to lose if it does not play out.
The measured move. A measured move is a projection based on the size of the pattern itself. Under this measurement approach, the projected distance equals the depth of the base, defined as the distance between the bottom of the base and the neckline.
In principle, it works like this. Call the depth of the base D. The measured move projects a move of roughly the same size, D, once price has broken the neckline. A larger pattern gives a larger projection, and a smaller one gives a shorter projection.
Treat this as a rough yardstick, not a forecast. Price may fall less, fall further or reverse altogether. The projection says nothing about timing either.
Stop losses. A stop loss is an order that closes a trade at a set loss limit. In pattern analysis, risk is usually linked to the pattern's structure: the point at which the rounding top idea would no longer hold. If price moves back beyond that point, the reason for the analysis has gone.
A stop is a plan, not a promise. In fast markets or after price gaps, a stop order can fill at a worse price than requested. This is called slippage.
Position sizing. Position sizing means choosing a trade size so that, if the stop is hit, the loss stays within a limit set in advance. Stop distance and trade size work together: a wider stop means a smaller position for the same loss limit.
Leverage. These markets are often traded as CFDs, contracts for difference, which track price moves without owning the asset. CFDs use leverage: opening a larger position with a smaller deposit, called margin. Leverage magnifies losses as well as gains. Losses can build quickly, and traders can lose all the money they deposit.
Rounding Top vs Head and Shoulders, Double Top and Rounding Bottom
Several reversal patterns look alike at a glance. Knowing the differences helps avoid labelling the wrong shape.
- Rounding top vs head and shoulders. A head and shoulders pattern has distinct peaks: a left shoulder, a higher head and a right shoulder, with a neckline through the dips between them. A rounding top has no distinct peaks, just one smooth curve. Both are bearish reversal patterns confirmed by a neckline break.
- Rounding top vs double top. A double top shows two clear peaks at roughly the same height, with a dip between them. A rounding top can resemble a double or triple top, and the shapes can even develop together, for example when small peaks sit inside a broad dome.
- Rounding top vs rounding bottom. A rounding bottom, sometimes called a saucer bottom, is the U-shaped opposite. It turns up after extended downtrends and represents a long consolidation during which the bias shifts from bearish to bullish. In its ideal form, volume runs high as the decline begins, falls away as the decline ends and picks up again as price advances.
The main differences, then, are the number of peaks, the sharpness of the turn and the direction of the trend before the pattern.
How Reliable Is the Rounding Top Pattern?
No chart pattern works every time, and the rounding top is no exception. It describes what price and volume have done so far. It cannot tell anyone what happens next.
- It is clearer in hindsight. A finished dome looks obvious. While it forms, the same shape can be a pause before the uptrend resumes.
- It is slow. Because the pattern can take weeks, months or longer, the picture can change many times before it completes.
- Volume rules are guides. The ideal volume sequence is a rough guide, not a strict rule. Real charts are messy, and volume often strays from the textbook picture.
- Shape is subjective. Two analysts can draw different necklines on the same chart and judge the break differently.
False breakouts. A false breakout happens when price moves below the neckline but quickly climbs back above it. Sellers who acted on the break are caught out, which is why such moves are called bear traps. A very steep decline is one warning sign: instead of a genuine rounding top, the drop may turn out to be a bear trap.
This is why many analysts wait for price to hold below the neckline rather than react to the first touch. Even then, a confirmed pattern can fail, so it works best as one input among several.
Using the Rounding Top Chart Pattern in Your Analysis
The rounding top is a slow, curved reversal pattern that reflects a gradual shift from buying to selling pressure. It needs a prior uptrend, a smooth dome, a supportive volume pattern and a break that holds below the neckline.
The measured move offers a rough yardstick, while stop losses and position sizing are the usual tools for defining risk. The pattern's weaknesses matter just as much: it is slow, subjective and prone to false breakouts. Studying historical charts can help build an eye for the shape, but no pattern removes the risk of loss.

FAQ
Risk disclaimer: CFDs are complex instruments and come with a high risk of losing money rapidly due to leverage. You should consider whether you understand how CFDs work and whether you can afford to take the high risk of losing your money. Never deposit more than you are prepared to lose. Professional client’s losses can exceed their deposit. Please see our risk warning policy and seek independent professional advice if you do not fully understand. This information is not directed or intended for distribution to or use by residents of certain countries/jurisdictions including, but not limited to, USA & Countries included in the OFAC sanction list. The Company holds the right to alter the aforementioned list of countries at its own discretion.
TIOmarkets offers an exclusively execution-only service. The views expressed are for information purposes only. None of the content provided constitutes any form of investment advice. The comments are made available purely for educational and marketing purposes and do NOT constitute advice or investment recommendation (and should not be considered as such) and do not in any way constitute an invitation to acquire any financial instrument or product. TIOmarkets and its affiliates and consultants are not liable for any damages that may be caused by individual comments or statements by TIOmarkets analysis and assumes no liability with respect to the completeness and correctness of the content presented. The investor is solely responsible for the risk of his/her investment decisions. The analyses and comments presented do not include any consideration of your personal investment objectives, financial circumstances, or needs. The content has not been prepared in accordance with any legal requirements for financial analysis and must, therefore, be viewed by the reader as marketing information. TIOmarkets prohibits duplication or publication without explicit approval.
Join us on social media


Authors BIO

Eleni is a financial markets enthusiast contributing to content covering forex, indices, commodities, and global market developments. She is passionate about researching market-related topics and helping make financial information more accessible to traders.